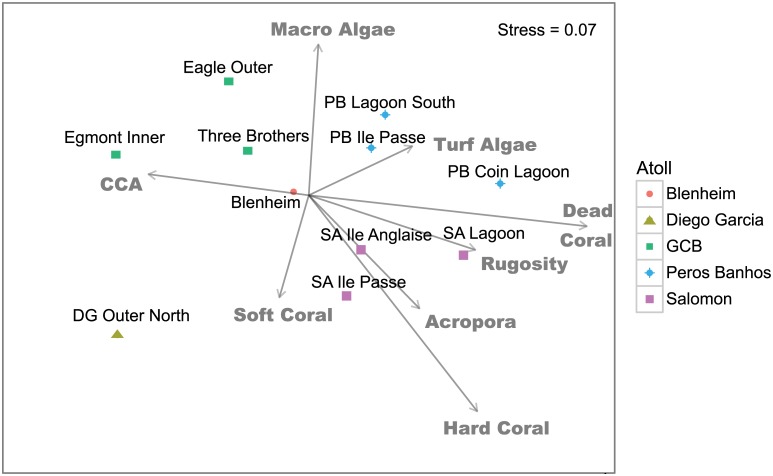
Fig 5. nMDS diagram showing the relationship between benthic variables at 11 reef sites overlaid on the fish assemblage ordination (see Fig 2) across the Chagos Archipelago.
The relative contribution of each benthic variable is displayed by the length of the vector.

