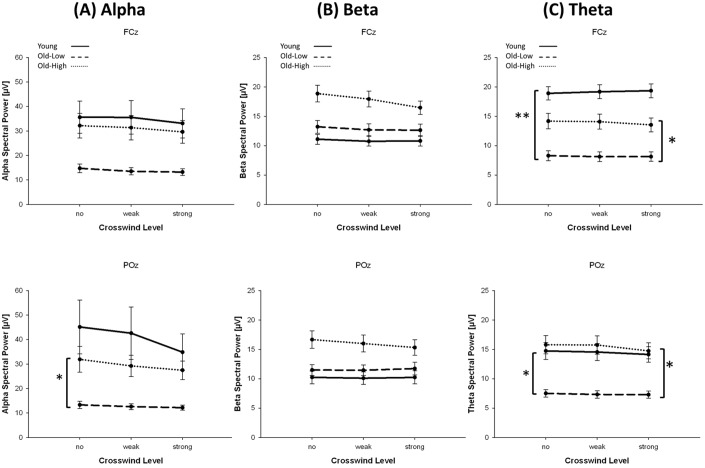
Fig 3. Oscillatory brain activity in different frequency bands.
Spectral power (means and standard errors of means) of fronto-central and posterior Alpha (A), (overall) Beta (B) and Theta (C) band as function of crosswind level (no, weak, strong), shown for younger participants and older participants with high (Old-High) and low (Old-Low) driving lane variability. Significant group differences are indicated by asterisks; *p < .05; **p < .01.

