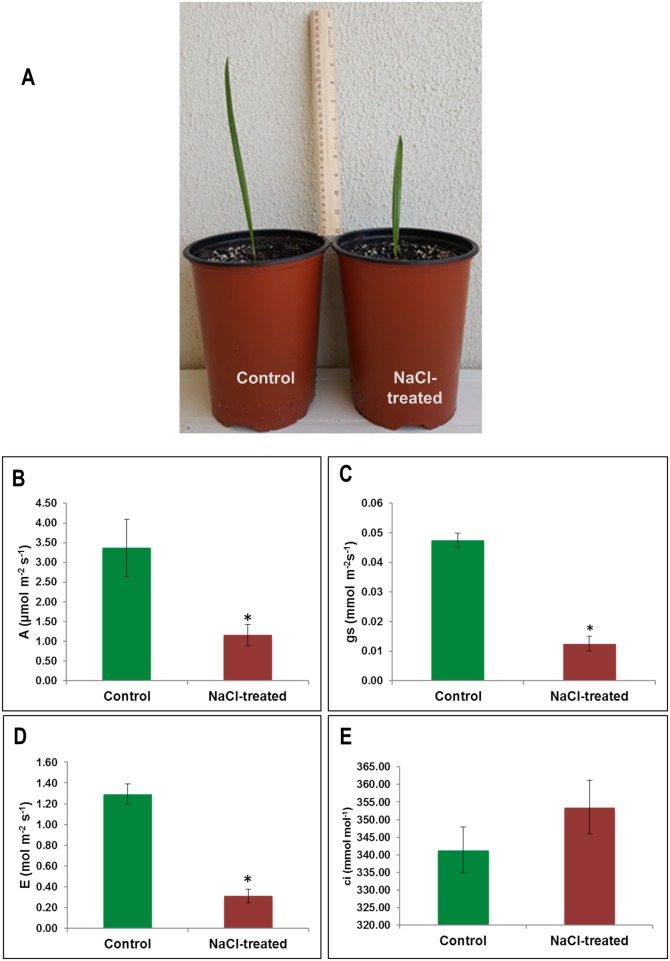
Fig 1. The effect of salinity treatment on photosynthesis performance (A), photosynthesis rate (A) (B), stomatal conductance (gs) (C), transpiration rate (E) (D), and internal CO2 concentration (ci).
The values are means (n = 4) and error bars represent SE (p < 0.05). Significant differences are marked by an asterisk.

