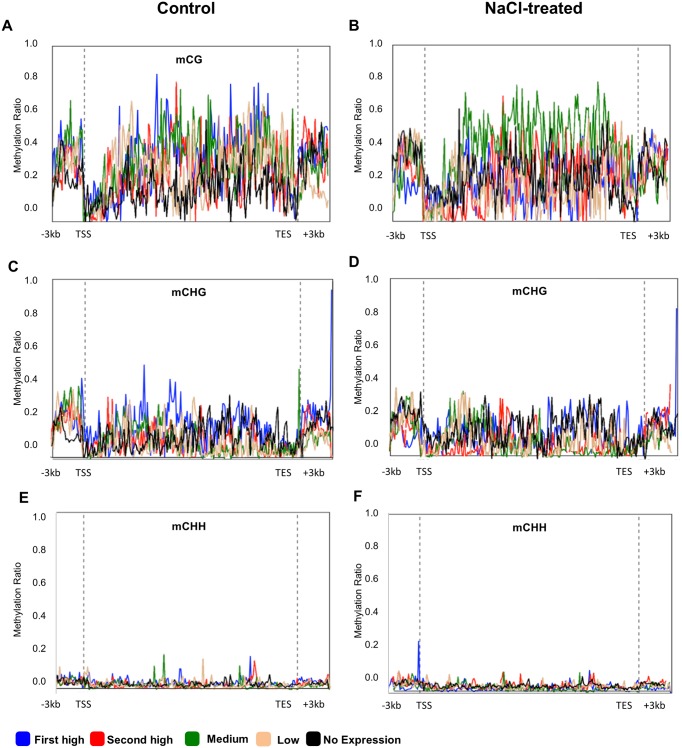
Fig 8. DNA methylation (mCG, mCHG and mCHH) profile among pseudogenes, grouped based on their expression level (first high (blue line), second high (red line), medium (green line), low (beige line) and no expression (black line)).
The Y-axis represents the DNA methylation ratio of each group, while the X-axis represents studied gene regions of DMGs including protein-coding region, the transcription start site (TSS), the transcription end site (TES) and 3Kb up and down-steam the TSS and the TES, respectively.

