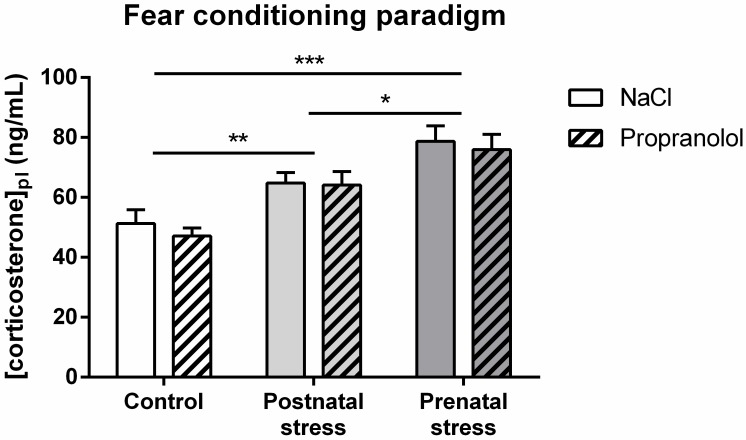
Fig 13. Effect of early stress influence on plasma corticosterone after FC tests.
Histograms represent plasma corticosterone concentrations (mean + SEM) in 8 week-old mice in the various groups. *: p < .05 compared with Postnatal stress group, **: p < .01 and ***: p < .001 compared to the Control group.

