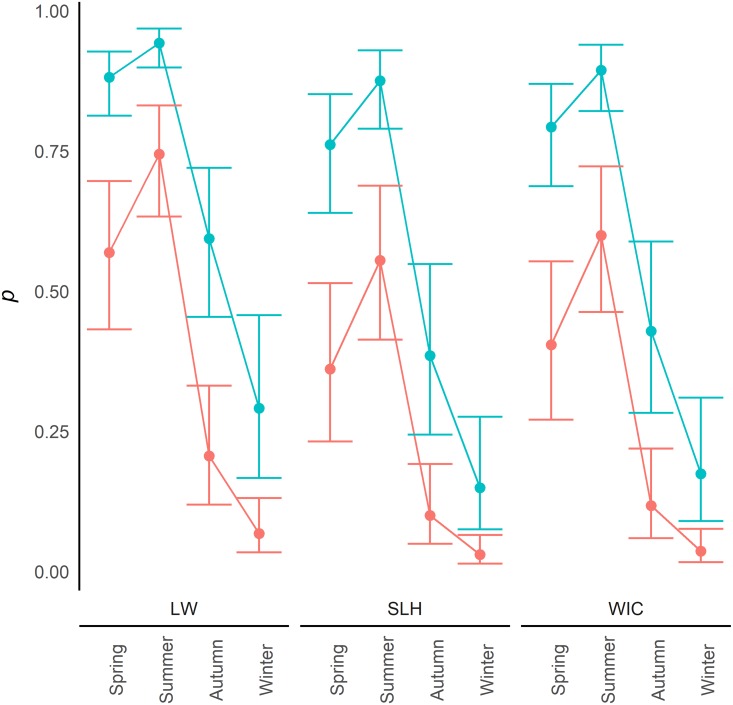
Fig 1. Seasonal detection probability.
Variation in detection probability (p) between water samples (Blue) and sediment samples (Red) across the seasons, in the different study areas (LW—Little Wittenham; SLH—Stanford-le-Hope; WIC—Wickford), with 95% confidence intervals. These results are based on a clay substrate and an HSI of 0.65 (a score considered mid-range for great crested newt occupancy). Comparisons with ponds in other HSI categories are shown in S1 Fig.

