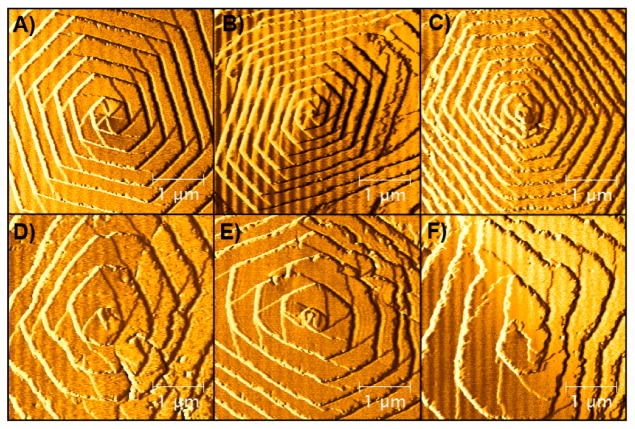
Figure 2.
AFM images of crystal growth on the (001) basal plane in the presence of 1a, (A) 15 μM, (B) 30 μM, and (C) 45 μM, and 1b, (D) 15 μM, (E) 30 μM, and (F) 45 μM. All images were taken ~25 min after injection of inhibitor. The roughening of the {100} steps in the presence of 1a and 1b is evident.

