
Figure 2. Presynaptic DG inactivity drives elaboration of DG-CA3 synapses.
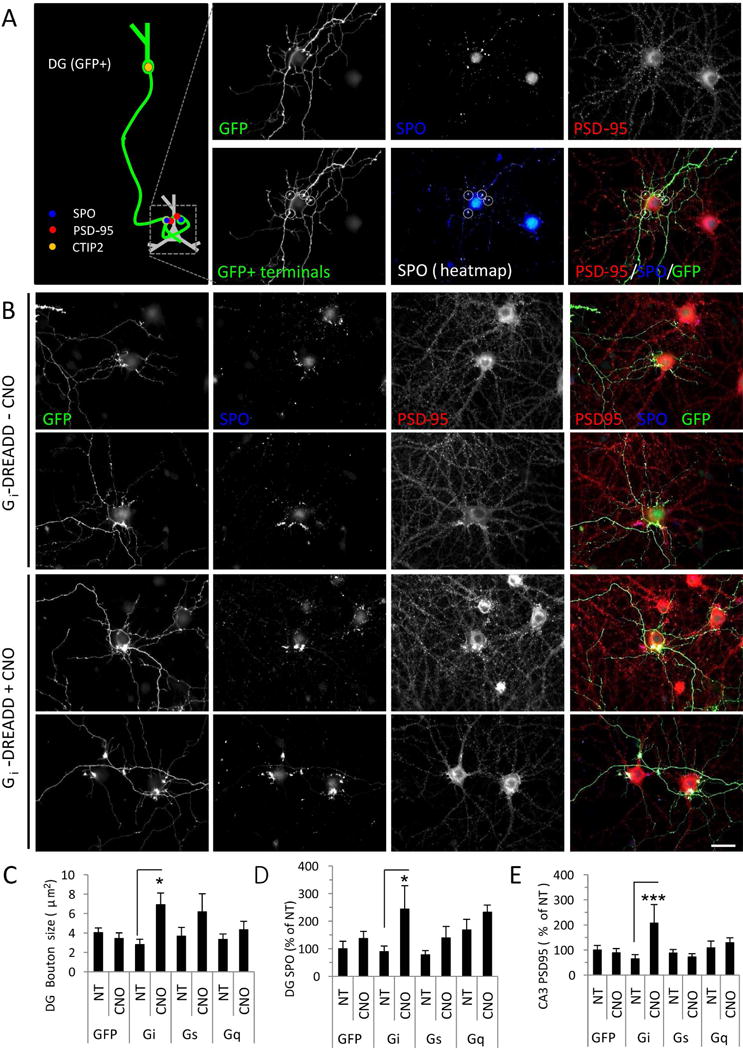
(A) Left: Schematic illustrating the in vitro DG-CA3 activity assay. The axon of a GFP-filled DG neuron is traced to the SPO-positive terminal on the proximal dendrites of the postsynaptic CA3 target (GFP negative). Right: Representative images of neurons immunostained for GFP (green) to reveal transfected DG neurons, synaptoporin (SPO, blue) to label presynaptic DG terminals, and PSD-95 (red) to label excitatory synapses. Bottom row shows selection of GFP+ terminals for analysis. (B) DG neurons were transfected with GFP and Gi-DREADD and left untreated (top) or activated by addition of CNO (bottom). (C-D) Quantification of bouton size (C) and presynaptic SPO accumulation (D) in axon boutons from DG neurons transfected with GFP vector control, or with Gi-, Gs-, or Gq- DREADD, in the absence (NT) or presence of CNO. (E) Quantification of postsynaptic PSD-95 accumulation in untransfected CA3 neurons opposite DG neurons transfected and treated as indicated. Data are expressed as mean±SEM from neuronal averages (N=10 neurons/condition, 2–5 boutons/neuron). *P<0.05, ***P<0.001 NT vs. CNO, ANOVA and post hoc Bonferroni multiple comparison test. Scale bars, 20 μm.