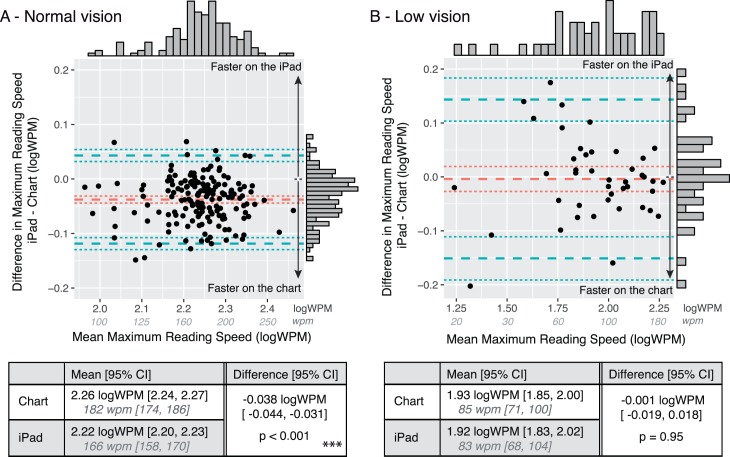
Figure 4.
Agreement between the Maximum Reading Speed (MRS) measured with the chart and the iPad app. (A) shows data from Experiment 1 (normally sighted participants). (B) shows data from Experiment 2 (low-vision participants). Bland-Altman plots show the difference between measured MRS (iPad-Chart) plotted against the mean MRS. The red dashed lines represent the average difference. The blue dashed lines represent the agreement limits (±1.96 SD). The dotted lines show the 95% CI limits. Top and right histograms show the data distribution along the x and y axis respectively. Tables summarize the chart and iPad average values as well as their difference (as given by the LME models).

