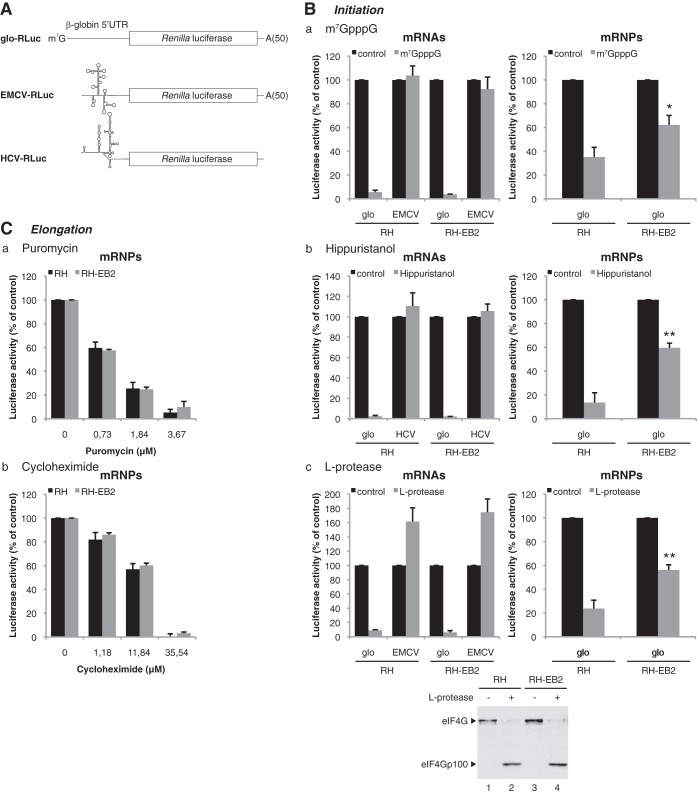
FIG 5.
EB2 strongly reduces the sensitivity of its associated mRNPs to translation initiation inhibitors. (A) Schematic representation of mRNA expressed from the constructs containing the Renilla luciferase reporter gene driven by either the 5′UTR of β-globin or the EMCV or HCV IRES. These were in vitro transcribed with a cap and a poly(A) tail in the case of the glo-RLuc construct, without a cap but with a poly(A) tail in the case of the EMCV-RLuc construct, or without a cap and a poly(A) tail for the HCV-RLuc construct. (B) For mRNAs, luciferase activity from 2.7 nM glo-RLuc mRNA translated for 30 min in the hybrid system containing ribosomes prepared from mock-transfected HeLa cells (RH) or cells transfected with an EB2 expression vector (RH-EB2) in the presence of 100 μM cap analog (m7GpppG) (panel a), 10 μM hippuristanol (panel b), or 0.2 μl of RRL expressing L protease (panel c) is shown. The EMCV-RLuc construct was used as a control in panels a and c, while in panel b the HCV-RLuc construct was used as a control. For mRNPs, luciferase activity from mRNPs associated with the ribosome pellet prepared from HeLa cells transfected with 6 μg or 0.5 μg of expression vector for the glo-RLuc reporter, respectively, without (RH) or with (RH-EB2) an expression vector for EB2 is shown. The translation was carried out for 30 min in the hybrid system in the presence of 100 μM cap analog (m7GpppG) (panel a), 10 μM hippuristanol (panel b), or 0.2 μl of RRL expressing L protease (panel c). The efficiency of cleavage of eIF4G by the L protease in both the RH and RH-EB2 lysates was verified by Western blotting (bottom panel). (C) Luciferase activity from mRNP associated with the ribosome pellet prepared from HeLa cells transfected with 6 μg or 0.5 μg of glo-RLuc expression vector, respectively, without (RH) or with (RH-EB2) an expression vector for EB2. Translation was carried out for 30 min in the hybrid system in the presence of different concentrations of puromycin (panel a) or cycloheximide (panel b). The results are expressed relative to the control, which was set to 100%, and they are presented as mean ± SD from three independent experiments (n = 3). *, P < 0.05; **, P < 0.01 (two-tailed paired t test).

