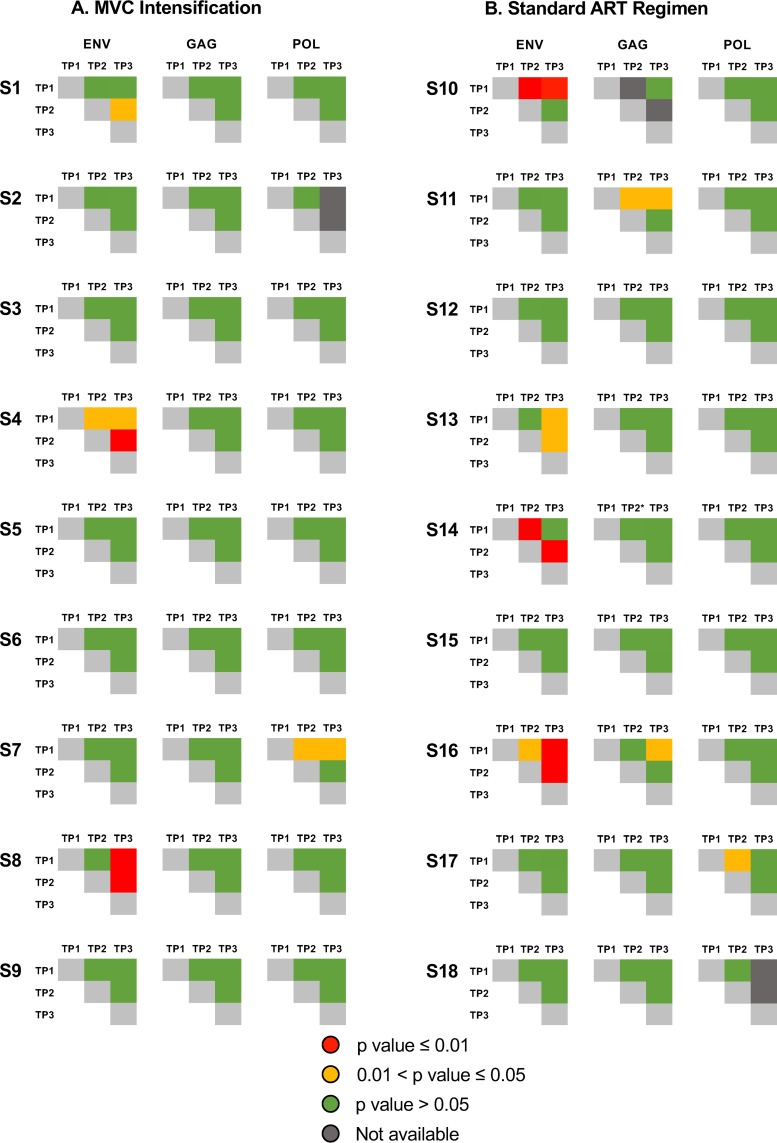
FIG 4.
Test for panmixia across time points and across 3 HIV coding regions. We computed the fixation index (FST) for all longitudinal samples and each of the 3 coding regions to evaluate the genetic structure of the population (65). The P value threshold for panmixia was set to 0.01 and 0.05, and 10,000 iterations were performed for each set. Significant compartmentalization is shown in yellow (P < 0.01) and red (P < 0.05), and panmixia is shown in green.

