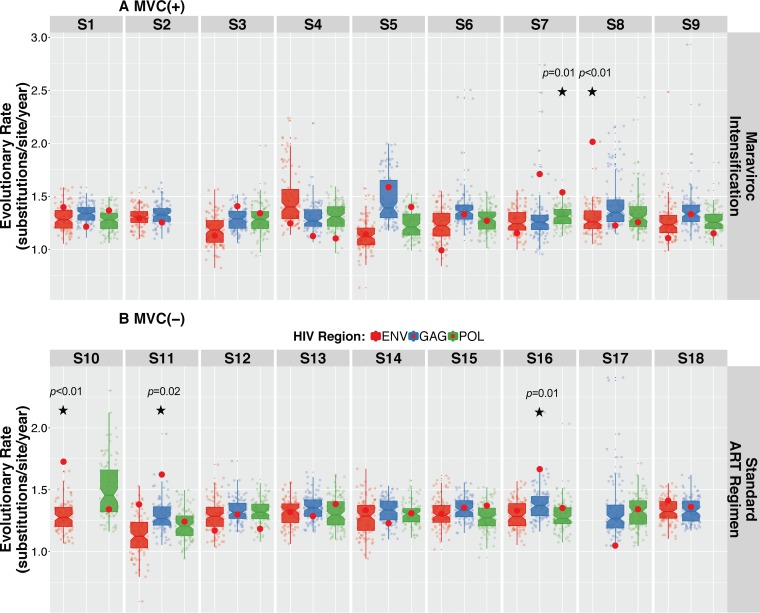
FIG 7.
Coefficient of variation of the substitution rates for HIV env, gag, and pol regions of actual data set versus randomly permuted replicates. The coefficient of variation was determined as mean evolutionary rate divided by variance, where variance is 95% upper HPD minus 95% lower HPD. The coefficients of variation for the real data sets were not significantly different from those estimated from the data sets with randomly permutated tip dates in all but 5 regions (45/50, 90%). The P value represents the number of times the coefficient of variation of the true data set was smaller than the coefficient of variation in the permuted replicates (72, 73). The hypothesis of significant temporal structure was rejected when the P value was above 0.05.

