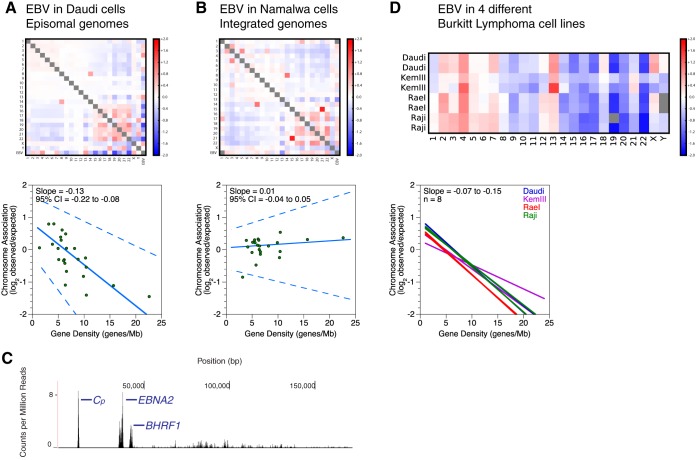
FIG 1.
Episomal EBV genomes associate with the human genome in correlation with chromosomal gene density. (A and B) Interchromosomal contacts involving the EBV and human genomes in the Daudi and Namalwa cell lines as measured by Hi-C. Heat maps of chromosome associations between chromosomes and between each human chromosome and the EBV genome are shown. Observed counts are normalized against random expectation and shown on a log2 scale. Red indicates enrichment, and blue indicates depletion. Scatterplots depict virus-human chromosome associations plotted against the gene density of each chromosome. A solid line indicates the Thiel-Sen fit, and dashed lines indicate the 95% confidence interval. Results are representative of two independent biological replicates. (C) Deep sequencing of EBV transcription in the Namalwa cell line. The x axis denotes nucleotide position, and the y axis denotes the number of counts per million mapped reads. RNA signals with unambiguously assignable annotations are marked. BHRF1, Cp, and EBNA2 (blue) are latent transcripts. Results are representative of two independent biological replicates. (D) Interchromosomal contacts between the EBV and human genomes in Burkitt lymphoma cell lines as measured by Hi-C. A heat map of chromosome associations between each human chromosome and the EBV genome in different Burkitt lymphoma cell lines is shown. Data shown are for two replicates of four different cell lines (Daudi, KemII, RaeI, and Raji). Observed counts are normalized against random expectation and shown on a log2 scale. Red indicates enrichment, and blue indicates depletion. Gray boxes represent either Y chromosomes not present in the female RaeI cell line or scores with absolute values of >2. In the graph at bottom, solid lines indicate the Thiel-Sen fits of virus-human chromosome associations plotted against the gene density of each chromosome. Each line represents one of two independent biological replicates for four different cell lines.

