FIG 6.
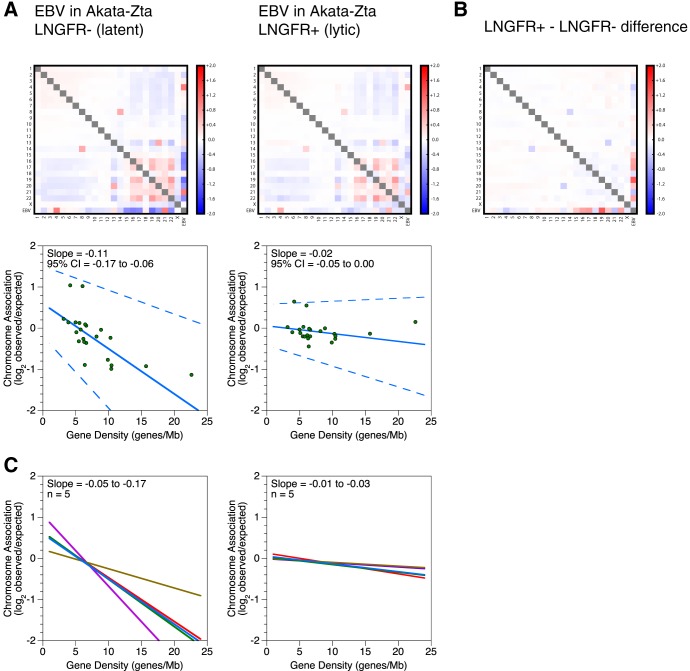
Chromosome association preferences of EBV episomes restructure during reactivation. (A) Interchromosomal contacts involving the EBV and human genomes in the Akata-Zta cell line as measured by Hi-C. LNGFR− and LNGFR+ cells contain latent and lytic episomes, respectively. Heat maps of chromosome associations between chromosomes and between each human chromosome and the EBV genome during latency and reactivation are shown. Observed counts are normalized against random expectation and shown on a log2 scale. Red indicates enrichment, and blue indicates depletion. Scatterplots depict virus-human chromosome association plotted against the gene density of each chromosome. A solid line indicates the Thiel-Sen fit, and dashed lines indicate the 95% confidence interval. Results are representative of five independent and paired biological replicates. (B) Changes in interchromosomal contacts involving the EBV and human genomes in the Akata-Zta cell line upon reactivation, as measured by Hi-C. The subtraction heat map depicts differences between the latent and lytic chromosome associations shown in panel A. Chromosome association values for latency were subtracted from the values for reactivation. Results are representative of five independent and paired biological replicates. (C) Interchromosomal contacts between the EBV and human genomes in the Akata-Zta cell line as measured by Hi-C. LNGFR− and LNGFR+ cells contain latent and lytic episomes, respectively. Solid lines indicate the Thiel-Sen fits of virus-human chromosome associations plotted against the gene density of each chromosome. Each line represents one of five independent biological replicates. Paired comparisons are matched by color.

