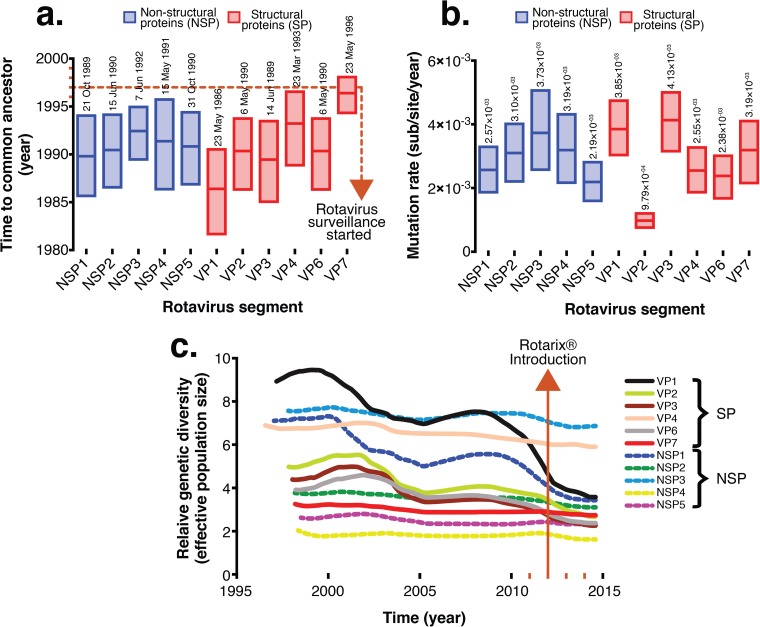
FIG 4.
Time to the most recent common ancestor (tMRCA), evolutionary rates for each genome segment of Malawian G1P[8] strains, and comparative population dynamics of G1P[8] rotavirus strains circulating in Malawi, 1998 to 2014. (a) Evolutionary rates and tMRCAs for each genome segment of the atypical Malawian G1P[8] strains shown together with their 95% highest posterior density (HPD) intervals. (b) Absolute values for the means and ranges of evolutionary rates and tMRCA at 95% HPD intervals. (c) Phylogenies and relative genetic diversities estimated by using the Gaussian Markov random field (GMRF) model represent Bayesian Skygrid plots for VP1- to VP4-, VP6-, and NSP1- to NSP5-encoding genome segments. Lines in the GMRF plot represent the mean relative genetic diversity through time.

