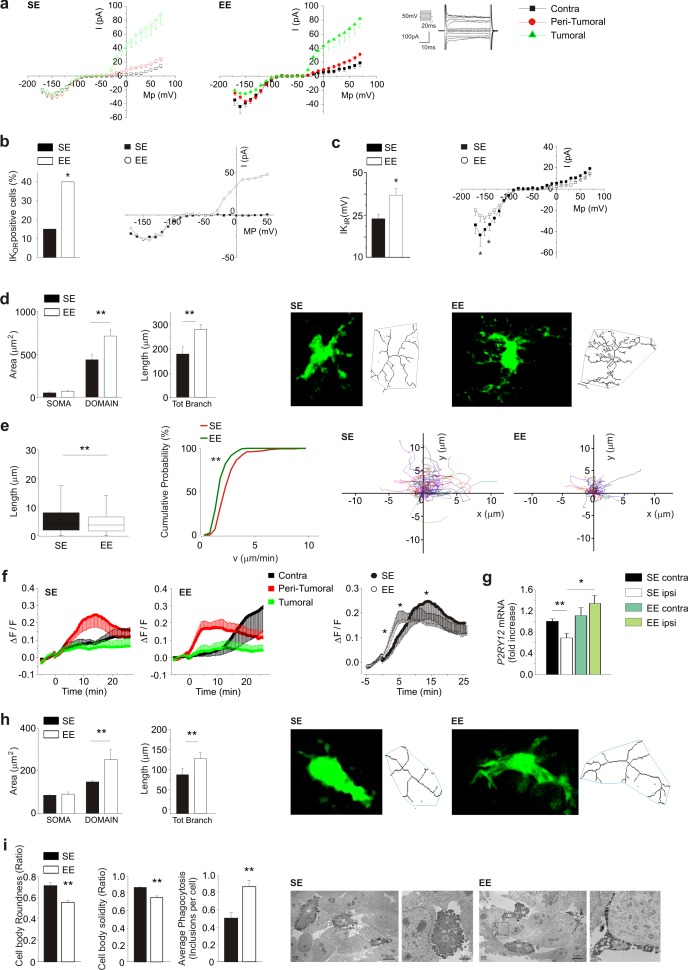
Figure 2. Effect of EE on myeloid cell morphology.
(a) Left: current/voltage relationship of microglia cells in response to voltage steps stimulation (steps from −170 to +70 mV, only one out of two steps are shown; holding potential −70 mV) in CLH (n = 38/9 mice), peritumoral area (n = 60/9 mice) and inside the tumor (n = 57/9 mice) of SE housed, GL261-bearing mice. Right: Current/voltage relationship of microglia cells in CLH (n = 27/9 mice), peritumoral area (n = 57/9 mice) and inside the tumor (n = 64/9 mice) of EE mice. (b) Percentage of GFP+-cells expressing Kor currents in the peritumoral area in SE and EE mice (∗p<0.05, z-test). Representative current/voltage relationships are shown on the right. (c) Amplitude of Kir current expressed by GFP+ cells in the peritumoral area in SE and EE mice (∗p<0.05, z-test). Representative current/voltage relationships are shown on the right. (d) Left: quantification of area of the soma and scanning domain of GFP+ cells measured by ImageJ in slices from GL261-bearing mice housed in SE or EE, as indicated (15 cells, 6 slices, 4 mice per condition, **p=0.0034, t-test). Center: total branch length of GFP+ cells in SE and EE (**p=0.0046, t-test). Right: representative images of maximum intensity projections of a confocal z-stack imaging on peritumoral area of GFP+ cells in SE and EE mice, converted to binary images and then skeletonized by the Analyze Skeleton plugin in Image J (green lines). (e) Length (left, **p=1.35E-24) and cumulative probability histogram of mean velocity (right, p=0.0053) of spontaneous (basal) movement of all single processes of the peritumoral area measured in SE (red, n = 177 tracks, 6 mice) and in EE (green, n = 210 tracks, 6 mice). Right images show reconstruction of basal process migration tracks in SE and EE. Individual tracks were aligned to the origin. (f) Time course of fluorescent ratio (ΔF/F) measured in a circle (10 μm radius) centered on the tip of the ATP puff pipette, in CLH (black, n = 9/9, SE; n = 7/9, EE), peritumoral (red, n = 11/9, SE; n = 12/9, EE) and intra-tumoral (green, n = 9/9, SE; n = 11/9, EE) areas of slices from Cx3cr1+/GFP mice housed in SE or EE. Note that the fluorescence increases around the pipette tip only in the peritumoral area (p<0.05; one-way ANOVA). Right: time course of fluorescence ratio evaluated in the peritumoral area of Cx3cr1+/GFP mice housed in SE (red, n = 11) and EE (black, n = 12) (p=0.041 at 3 min; p=0.035 at 8 min; p=0.018 at 15 min; t-test). (g) RT-PCR of P2RY12 gene in CD11b+ cells sorted from ILH and CLH of GL261-bearing mice, housed in SE or EE. Data are the mean ± S.E.M., *p<0.05 **p<0.01 versus CLH by one-way ANOVA, n = 4. (h) Representative SE and EE z-projections of GFP+ cells (skeletonized as above) into the tumoral area of Cx3cr1+/GFP mice. Left: 13 cells, 6 slices, 4 mice per condition, **p<0.01, Student’s t-test. Note that the scanning domain in the tumoral area was significantly smaller than that in the peritumoral area (p=0.021; t-test). Right: bar chart reporting the morphometric analysis of microglia branches (total branch length) of SE and EE microglia p=0.0031, t-test). (i) Ultrastructural analysis of cell body circularity and solidity, as well as average number of phagocytic inclusions in SE versus EE myeloid cells. Representative pictures showing IBA1-stained myeloid cells from both conditions are also provided. M = microglial cell body; m = microglial process; s = secretion granule; in = phagocytic inclusion; g = glioma cell. Data are the mean ± S.E.M., **p<0.01 by unpaired t-test; n = 25 cells from two animals in SE and n = 45 cells from three animals in EE.

