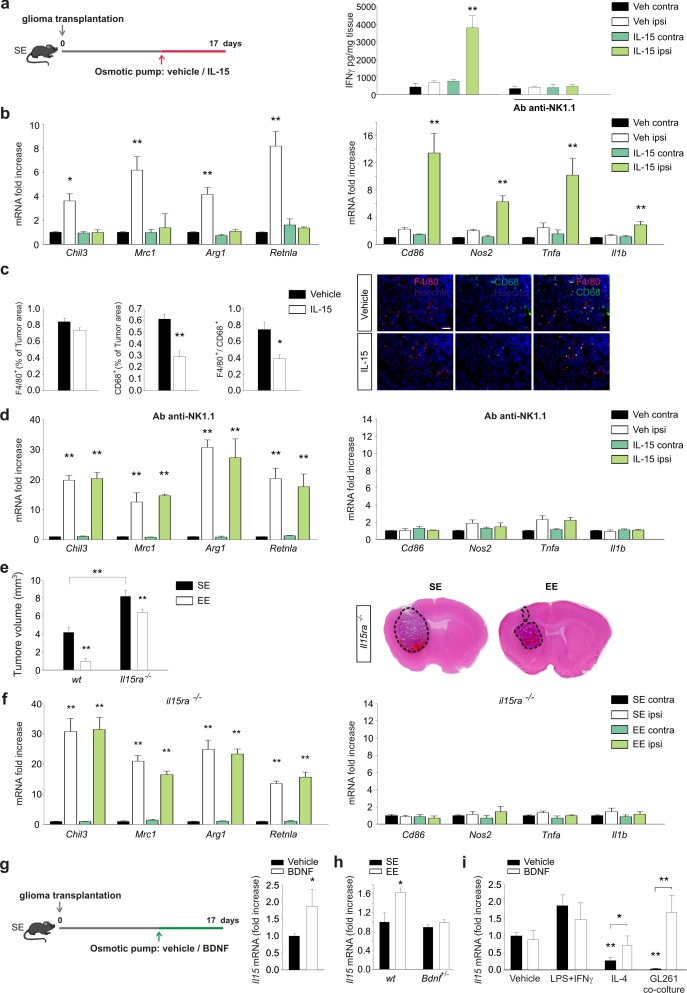
Figure 5. IL-15 is involved in the effects of EE on brain tumor.
(a) Left: mice housed in SE were infused for 7 days in the striatum, with vehicle or IL-15 through micro-osmotic pumps, starting 10 days after GL261 cell transplantation, as described in the scheme. Right: expression of IFN-γ in CLH and ILH of GL261-bearing mice treated with vehicle or Ab anti-NK1.1 as indicated, implanted with osmotic pumps releasing IL-15 or vehicle (n = 5, **p<0.01, one-way ANOVA). (b) RT-PCR of anti- (Chil3, Mrc1, Arg1, Retnla) and pro-inflammatory (Cd86, Nos2, Tnfa, Il1b) genes in CD11b+ cells sorted from ILH and CLH of GL261-bearing mice treated with IL-15 or vehicle. Data are expressed as mean ± S.E.M., *p<0.05 **p<0.01 versus CLH, one-way ANOVA; n = 4. (c) Myeloid cell activation (CD68) and infiltration (F4/80) in glioma mass in mice treated with IL-15 or vehicle, as shown in (a), analyzed at the end of treatment (17 days after glioma transplantation). Graph bars represent the mean (± S.E.M.) area expressed as percentage of total tumor area. Representative immunofluorescences are shown on the right (scale bar, 100 μm) (**p=0.002 *p=0.011 Student’s t-test; n = 4 mice per conditions). (d) RT-PCR of anti- and pro-inflammatory genes in CD11b+ cells isolated from ILH and CLH of GL261-bearing mice in vehicle and Ab-anti-NK1.1-treated mice, upon IL-15 or vehicle infusion, as shown in (a). Data are expressed as the mean ± S.E.M., **p<0.01 versus CLH, one-way ANOVA; n = 4. (e) Analysis of tumor volumes (expressed as mm3 ± S.E.M.) in wt or Il15ra–/– mice, housed in SE or EE; n = 5; **p<0.01, two-way ANOVA). Representative coronal sections are shown on the right. (f) RT-PCR of anti- and pro-inflammatory genes in CD11b+ cells sorted from ILH and CLH in Il15ra–/– mice, housed in SE or EE. Data are the means ± S.E.M., **p<0.01 versus CLH, one-way ANOVA; n = 4–5. (g) RT-PCR of Il15 mRNA in CD11b+ cells sorted from ILH and CLH of GL261-bearing mice treated with BDNF or vehicle. Data are the mean ± S.E.M., *p<0.05 versus CLH, one-way ANOVA; n = 5. Above: scheme of striatal infusion of vehicle or BDNF with micro-osmotic pumps starting 10 days after glioma cell transplantation and lasting 7 days, in SE mice. (h) RT-PCR of Il15 mRNA in CD11b+ cells isolated from ILH and CLH in wt or Bdnf+/– GL261 bearing mice, housed in SE or EE. Data are the mean ± S.E.M., *p<0.05 versus CLH, one-way ANOVA, n = 4. (i) RT-PCR of Il15 mRNA in primary mouse microglia stimulated with vehicle, LPS + IFNγ or IL-4 or in co-culture with GL261 for 24 h, in the presence or absence of BDNF. Data are expressed as the mean ± S.E.M., *p<0.05 **p<0.01, one-way ANOVA, n = 10.


