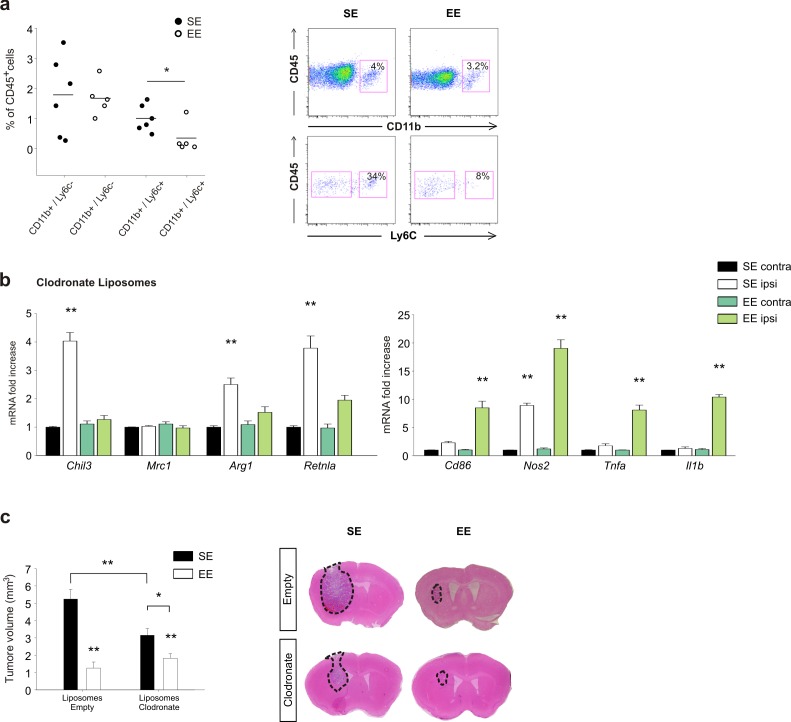
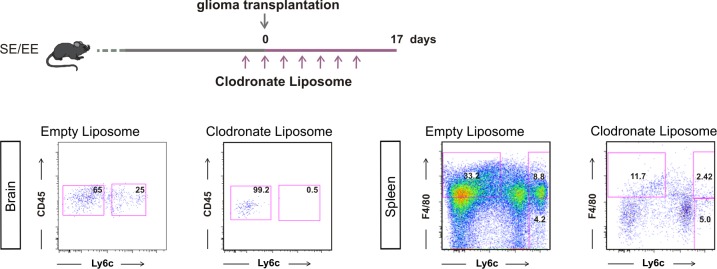
Figure 6. Effects of EE on mice treated with clodronate liposomes.
(a) Percentage of CD11b+ and Ly6c+ cells in the total CD45+ cell population obtained from the brain of EE or SE GL261-bearing mice (n = 5–6; *p=0.012, Student’s t-test). Representative FACS analyses are shown below. (b) RT-PCR of anti- and pro-inflammatory genes in CD11b+ cells sorted from ILH and CLH in empty or clodronate-filled liposome-treated mice, housed in SE or EE. Data are the mean ± S.E.M., **p<0.01 versus CLH by one-way ANOVA; n = 4. (c) Analysis of tumor volume (expressed as mm3 ± S.E.M.) in liposome filled with clodronate or empty liposomes-treated GL261-bearing mice, housed in SE or EE; n = 5; *p<0.05 **p<0.01, two-way ANOVA). Representative coronal section are shown on the right.


