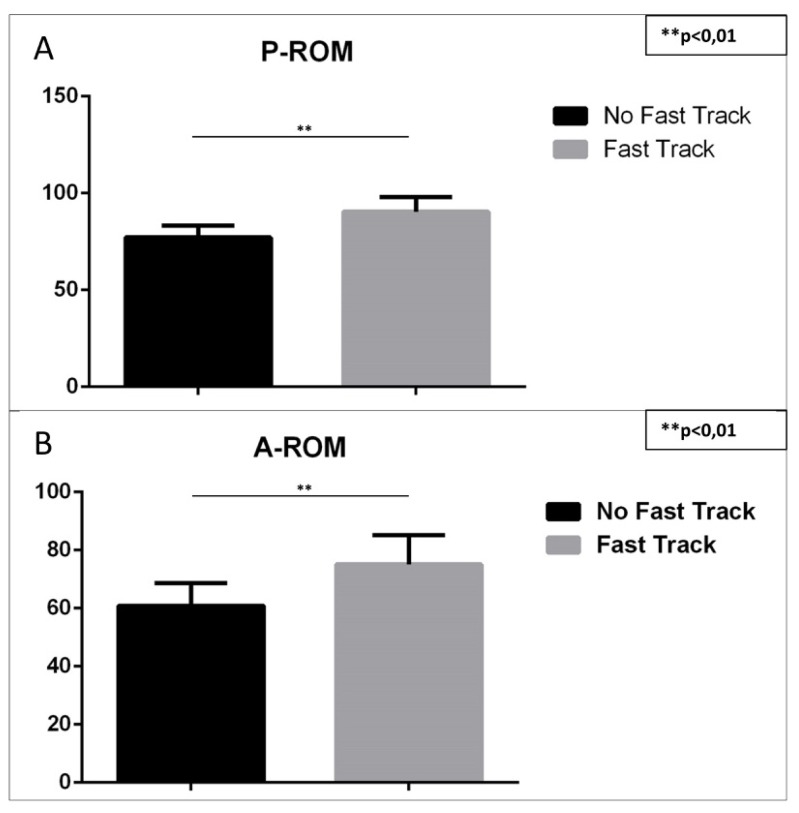
Figure 4 A, B.
Chart of P-ROM and A-ROM: A) Statistical analysis showed that the Fast Track P-ROM was very significantly greater than the No Fast Track P-ROM (p<0.01); B) Statistical analysis showed the Fast Track A-ROM was very significantly greater than the No Fast Track A-ROM (p<0.01). The Fast Track group showed a better ROM performance of ROMs.

