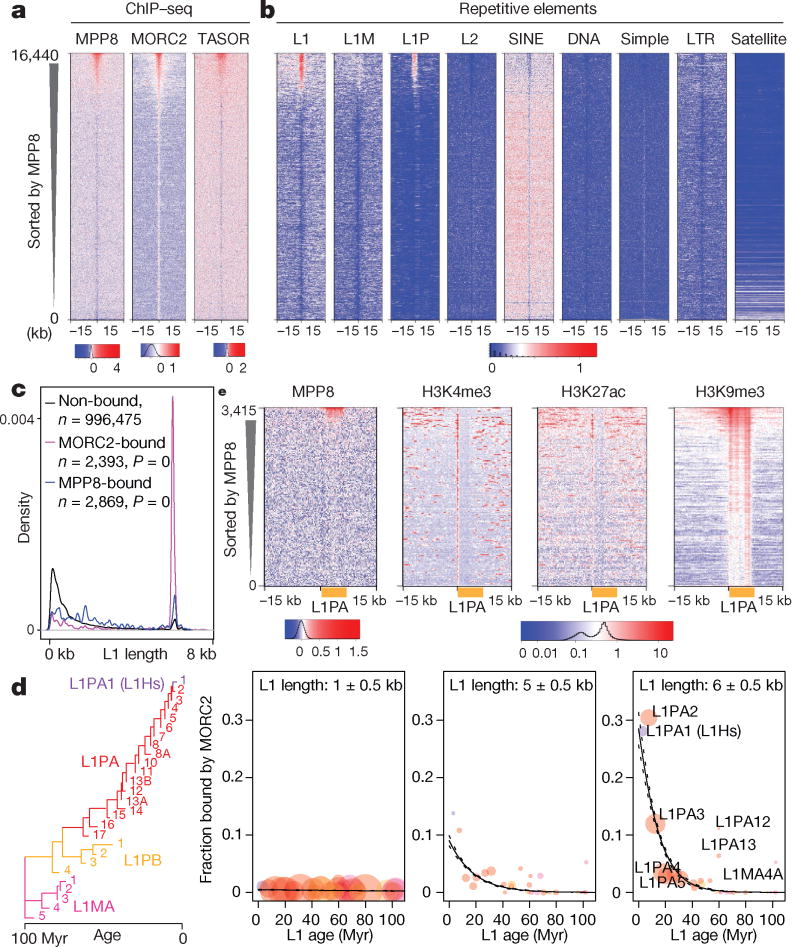
Figure 3.
HUSH/MORC2 target young full-length L1s in euchromatic environment.
a. Heatmaps showing signal enrichment of ChIPs with indicated antibodies in K562 cells, sorted by MPP8 ChIP signal and centered on MPP8 and MORC2 peaks. Plotted is normalized ChIP signal (Ctrl subtracted with corresponding KO).
b. Heatmaps showing MPP8 and MORC2 ChIP signal enrichment over repetitive elements, centered and sorted as in (a).
c. Size distribution of the L1s bound or unbound by MORC2 or MPP8 in K562 cells. P-values, two-tailed Kolmogorov-Smirnov test.
d. Fraction of MORC2–bound L1s (center values) as function of L1 length (three size classes are presented) and age (predicted from the phylogenetic analysis27) in K562 cells. Colored circles represent L1 families, with areas proportional to count of L1 instances with indicated age and length. n = 1,501 MORC2–bound L1 + 200,160 unbound L1. p = 2.2 × 10−90 for age–length interaction term, lower for simple terms (ANOVA, χ2 test), plotted logistic regression lines with 95% credible interval.
e. Heatmaps showing signal enrichment of ChIPs with indicated antibodies in K562 cells, centered on the 5’ end of full-length L1PAs.

