
Figure 2. Activity inequality is associated with obesity and increasing gender gaps in activity.
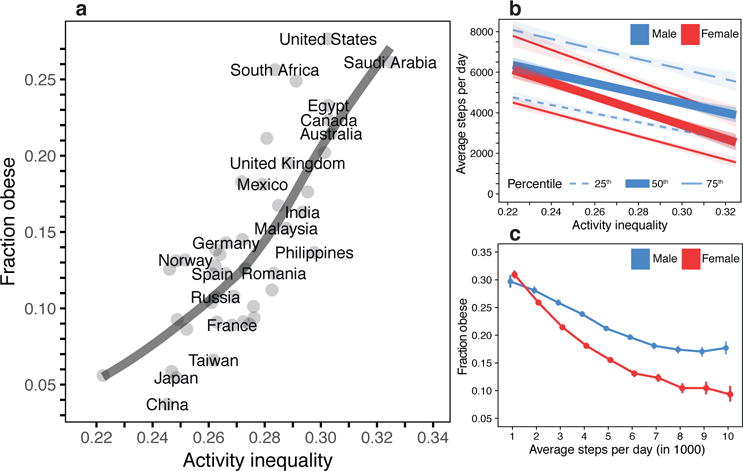
(a) Activity inequality predicts obesity (LOESS fit; R2 = 0.64). Individuals in the five countries with highest activity inequality are 196% more likely to be obese than individuals from the 5 countries with lowest activity inequality. (b) Activity inequality is associated with reduced activity, particularly in females. The figure shows the 25th, 50th, and 75th percentiles of daily steps within each country along with 95% confidence intervals (shaded) as a linear function of activity inequality. As activity inequality increases, median activity (50th percentile) decreases by 39% for males (blue) and by 58% for females (red). (c) Obesity-activity relationship differs between males and females and between high and low activity individuals. The plot shows the prevalence of obesity as a function of daily number of steps across all subjects in all countries (with 95% confidence intervals). For both males (blue) and females (red), a larger number of steps recorded is associated with lower obesity, but for females, the prevalence of obesity increases more rapidly as step volume decreases (232% obesity increase for females vs. 67% increase for males; comparing lowest vs. highest activity).