
Extended Data Figure 3. Activity inequality remains a strong predictor of obesity levels across countries when reweighting the sample based on officially reported gender distributions and when stratifying by gender or age.
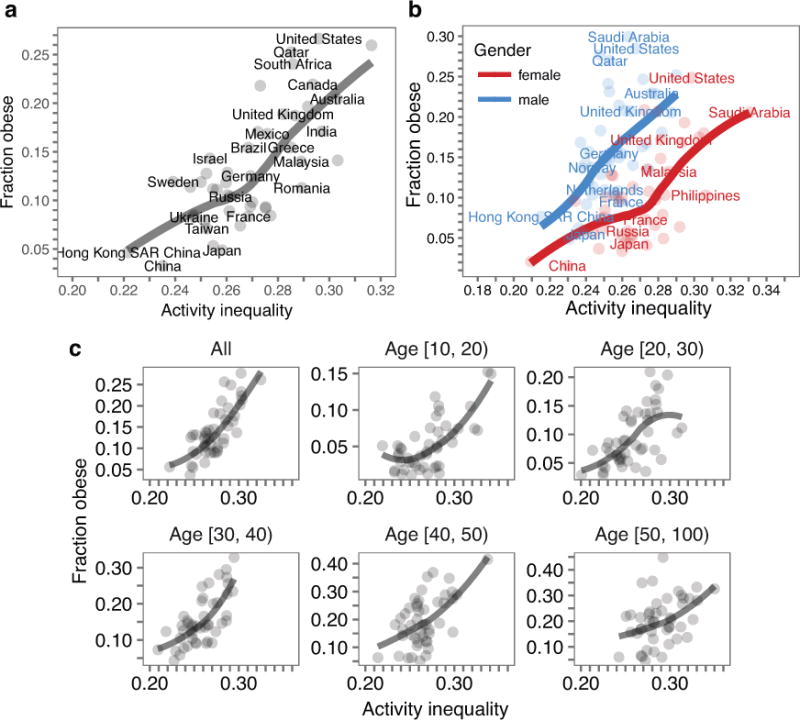
(a) Obesity versus activity inequality on country level where subjects are reweighted to accurately reflect the official gender distribution in each country (Methods). The gender-unbiased estimates are very similar to estimates using all data (r=0.953 for activity inequality and r=0.986 for obesity). (b) Obesity versus activity inequality on a country level for males and females. Activity inequality predicts obesity for both genders. (c) Obesity versus activity inequality on a country level across different age groups. We find associations between activity inequality and obesity persists within every single age groups. Older people are more likely to be obese (see y-axis ranging from 5% to 45% obesity for subjects older than 50 years) and more likely to get little activity (i.e., higher activity inequality on x-axis). These results indicate that our main result—activity inequality predicts obesity—is independent of any potential gender and age bias in our sample.