
Extended Data Figure 4. Relationship between activity inequality and obesity holds within countries of similar income.
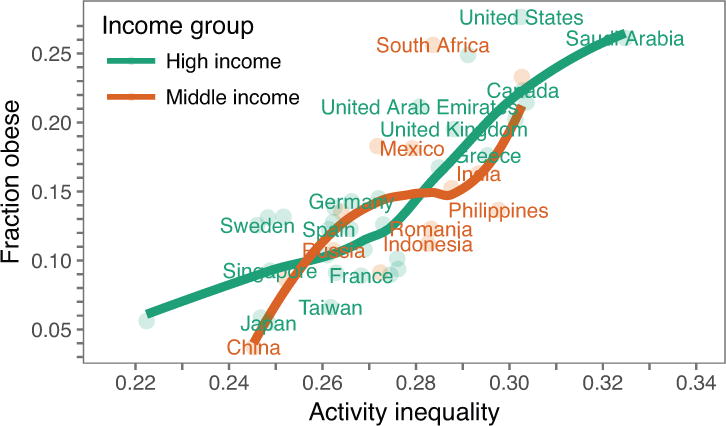
Out of the 46 countries included in our main result, we have 32 high income (green) and 14 middle income (orange) countries according to the current World Bank classification40. We find that activity inequality is a strong predictor of obesity levels in both high income countries as well as middle income countries. While in middle income countries, iPhone users might belong to the wealthiest in the population, in high income countries iPhones are used by larger parts of the population. The fact that we find a strong relationship between activity inequality and obesity in both groups of countries suggests that our findings are robust to differences in wealth in our sample.