
Extended Data Figure 5. Graphical definition of activity inequality measure using the Gini coefficient.
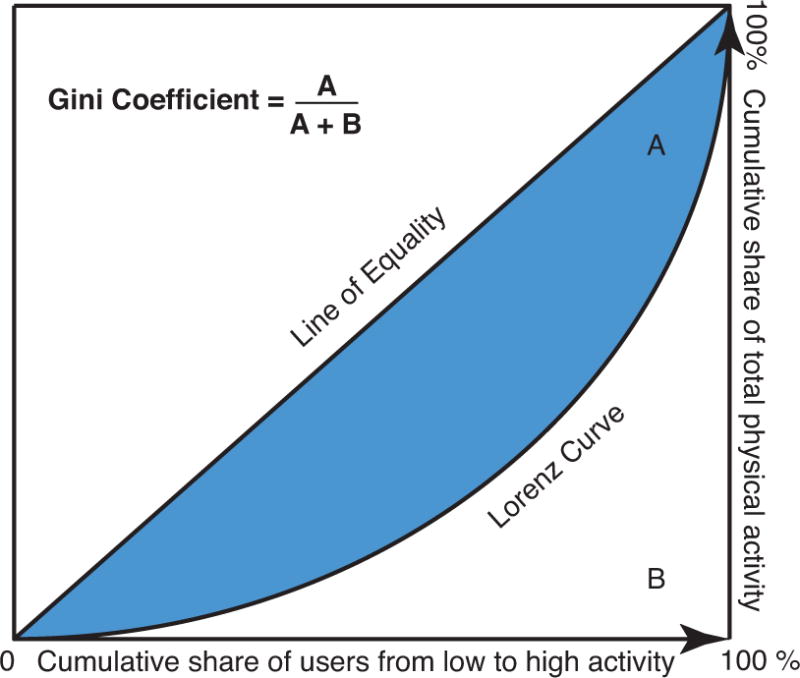
The Lorenz curve plots the share of total physical activity of the population on the y-axis that is cumulatively performed by the bottom x% of the population, ordered by physical activity level. The diagonal line at 45 degrees represents perfect equality of physical activity (i.e., everyone in the population is equally active). The Gini coefficient is defined as the ratio of the area that lies between the line of equality and the Lorenz curve (marked A in the diagram) over the total area under the line of equality (marked A and B in the diagram). The Gini coefficient for physical activity can range from 0 (complete equality) to 1 (complete inequality).