
Figure 1. Task design and goal state identification.
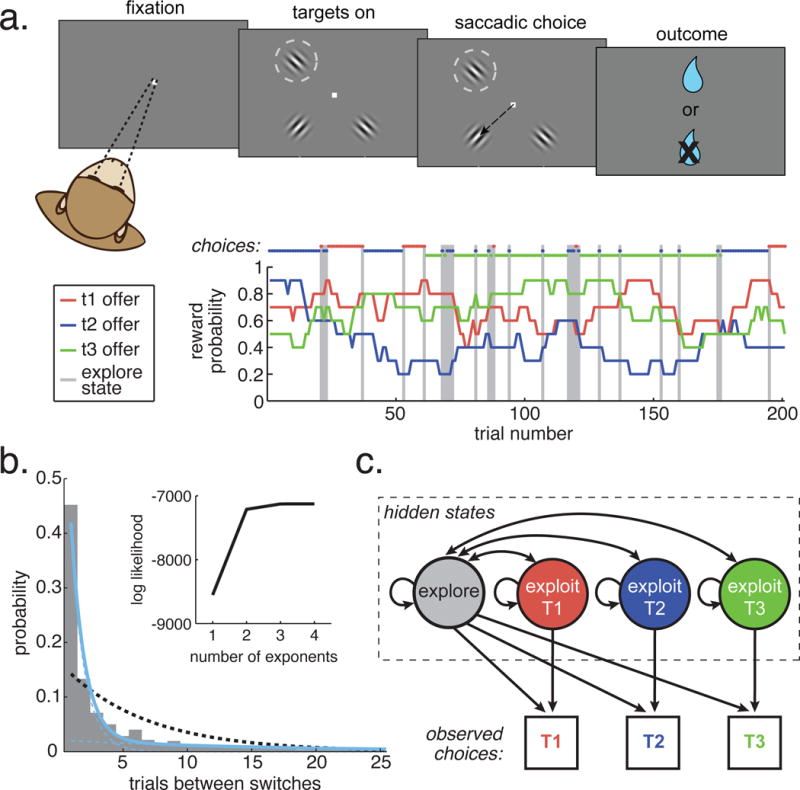
A) The task (top) was to choose between three probabilistically rewarded targets, one of which was placed in the receptive field of an FEF neuron (dotted circle). Bottom: Reward probabilities (lines) and choices (dots) for 200 example trials. Gray bars highlight explore-labeled choices. B) The distribution of times between switch decisions (inter-switch-intervals). A single probability of switching or continuous range of switch probabilities would produce exponentially distributed inter-switch intervals. Dotted black line: the maximum likelihood fit for a single discrete exponential distribution. Solid blue line: a mixture of two exponential distributions, with each component distribution in dotted blue. The two components reflect one fast-switching time constant (average interval: 1.6 trials) and one persistent time constant (17.2 trials). Inset) The log likelihood of mixtures of 1 to 4 exponential distributions. See also figure S1. C) A hidden Markov model, based on the different time constants for switching, was used to infer the goal state on each trial from the sequence of choices. The model included one persistent state for each target (“exploit”) and one state where the subjects’ were equally likely to choose any of the three targets (“explore”).