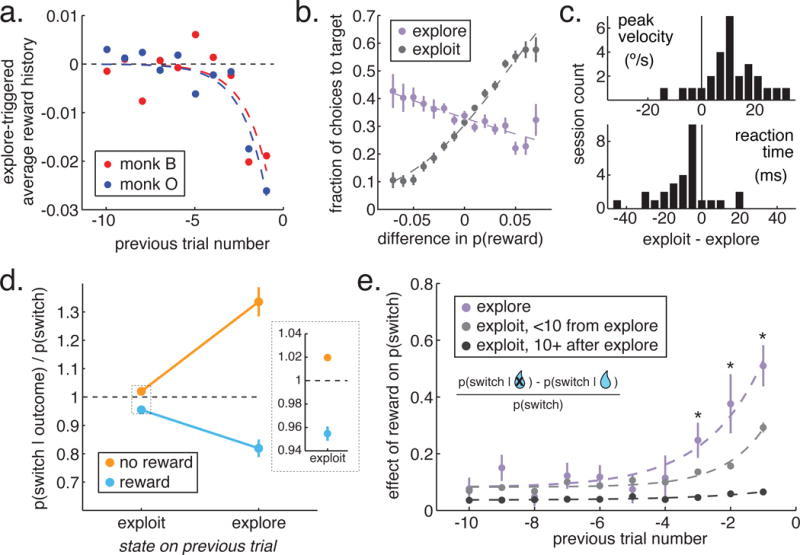
Figure 2. Features of explore and exploit-labeled choices.

A) The reward history filter preceding transitions into explore states (Wiener kernel analysis). B) Choice as a function of true reward probability for explore and exploit choices. X axis: Difference between each target and the mean of the alternatives. C) Difference in reaction time and peak velocity between explore and exploit choices. D) The probability that the monkeys would switch targets on the next trial, given this trials’ outcome and goal state. Inset: Exploit choices enlarged to show error bars. E) The effect of past reward outcomes on switch decisions as a function of time since the outcome (x-axis) and state at the time of the outcome (colors). * p < 0.05, paired t-test, n = 28 sessions. Data is normalized for illustration only, statistics were run on non-normalized data.
