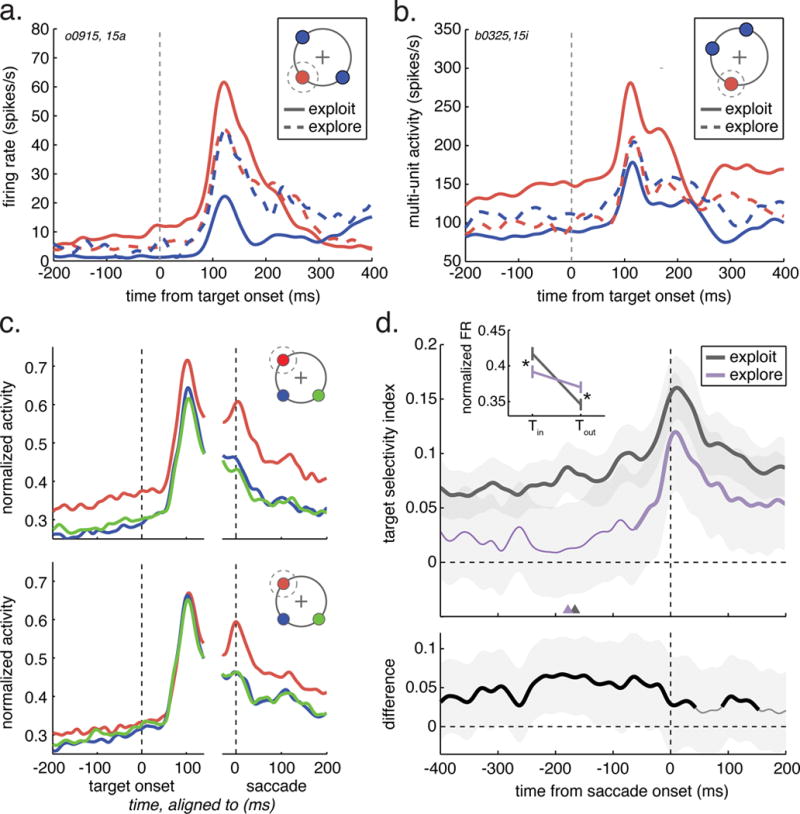
Figure 3. Target selectivity during exploration in single units.

A) A single neuron from monkey O. The cartoon illustrates the relative positions of the RF target (Tin, red) and the two non-RF targets (Tout, blue). Target selective firing rate measured during exploit choices (solid lines) and explore choices (dotted lines). B) Same as A, but for a multi-unit recorded in monkey B. C) Target selectivity across the population of recorded units (n = 574) during exploit choices (top), and explore choices (bottom). Red = Tin, blue = ipsilateral Tout, green = contralateral Tout. D) The target selectivity index averaged over all single neurons (monkey O, n = 83; monkey B, n = 48), plotted across time. Inset: Firing rate was suppressed for Tin choice and increased for Tout choice. Bottom: Difference in the target selectivity index between explore and exploit, averaged over single neurons. Thick lines in both top and bottom: significant difference from 0 in that epoch, p < 0.05, n = 131, shading: ± S.E.M. See also table S3, figure S5.
