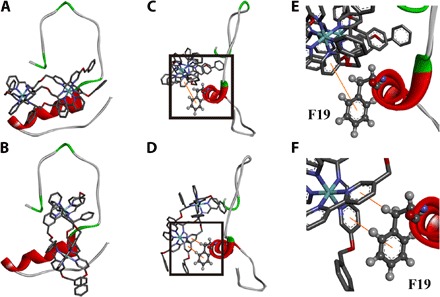
Fig. 6. The interaction of Aβ40 and B4 by docking study.

(A and B) Energy-minimized average models of ΛB4 (A) and ΔB4 (B) with Aβ40 interactions. (C and D) Hydrophobic interaction between Aβ40 and ΛB4 (C) and between Aβ40 and ΔB4 (D). (E) Locally amplified image of the black box in (C). (F) Locally amplified image of the black box in (D).
