
Figure 4. Identification of AXL+SIGLEC6+ DCs (AS DCs).
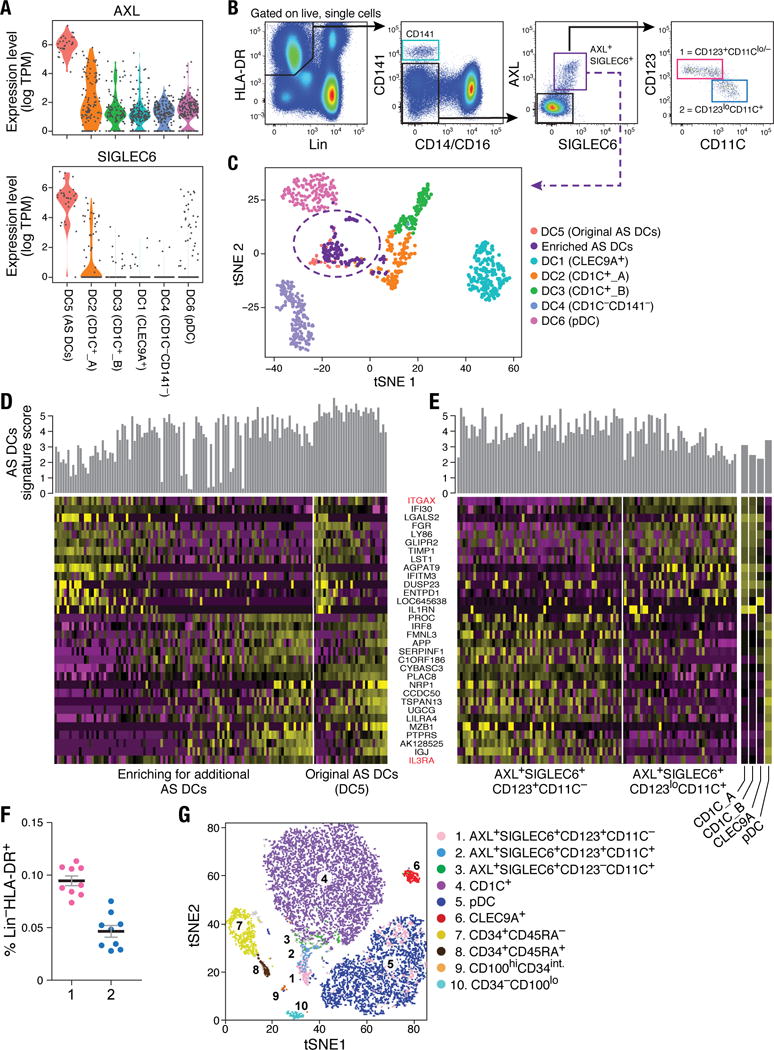
(A) Violin plots showing expression distribution of surface markers AXL and SIGLEC6. Other populations are depicted on the x axis; each dot represents an individual cell. (B) Flow cytometry gating strategy to identify AXL+SIGLEC6+ cells within human blood LIN(CD3, CD19, CD20, CD161)− and HLA-DR+ mononuclear fraction. AXL+SIGLEC6+ cells were further distinguished by the relative expression of IL3RA/CD123 and ITGAX/CD11C [1 = CD123+CD11c−/lo (pink); 2 = CD123loCD11c+ (blue)]. Data shown are a representative analysis of 10 healthy individuals. (C) t-SNE analysis of all DCs (n=742), along with prospectively profiled AXL+SIGLEC6+ single cells (n=105), using gating strategy in (B) (sorted from purple gate). Newly isolated AS DCs overlap with the originally identified DC5 cluster (n=30), indicated by purple dashed circle. (D) Heatmap reporting scaled expression (log TPM values) of discriminative gene sets (AUC cutoff ≥ 0.75), highlighting the expression continuum of AS DCs. Top bar graph defines the AS DCs population purity score based on the top 10 most discriminative genes (i.e., AXL, PPP1R14A, SIGLEC6, CD22, DAB2, S100A10, FAM105A, MED12L, ALDH2, and LTK). (E) Heatmap reporting scaled expression (log TPM values) of prospectively enriched AS DCs populations (n=90) isolated by relative ITGAX/CD11C and IL3RA/CD123 expression levels [red in (D)]; 43 single AXL+SIGLEC6+CD11C− [pink gate in (B)] and 47 single AXL+SIGLEC6+CD11C+ [blue gate in (B)] were sequenced. The average expression values of the original CD1C+ (combined DC2 and DC3), CD141+/CLEC9A+ (DC1) and pDC (DC6) single cells were used as reference to highlight enrichment of cDC-like and pDC-like gene sets. Top bar graph represents AS DC purity score. (F) Frequency (% mean ±SEM) of AXL+SIGLEC6+CD123+CD11C−/lo [population 1 (pink): 0.1 ± 0.014] and AXL+SIGLEC6+CD123loCD11C+ [population 2 (blue): 0.04 ± 0.01] as a percentage of LIN(CD3, CD19, CD20, CD161)−HLA-DR+ PBMCs. Scatter plot includes data from nine healthy individuals. (G) t-SNE analysis of flow cytometry data for LIN(CD3,CD19,CD20,CD161)−HLA-DR+CD14−CD16− PBMCs based on the protein expression levels of AXL, SIGLEC6, CD1C, CD11C, CD22, CD33, CD34, CD45RA, CD100, CD123, CD303 and HLA-DR (see Fig. 6 for CD100hiCD34int population). Overlay of populations defined by conventional flow cytometry gating on clusters derived by t-SNE analysis shown in the legend.