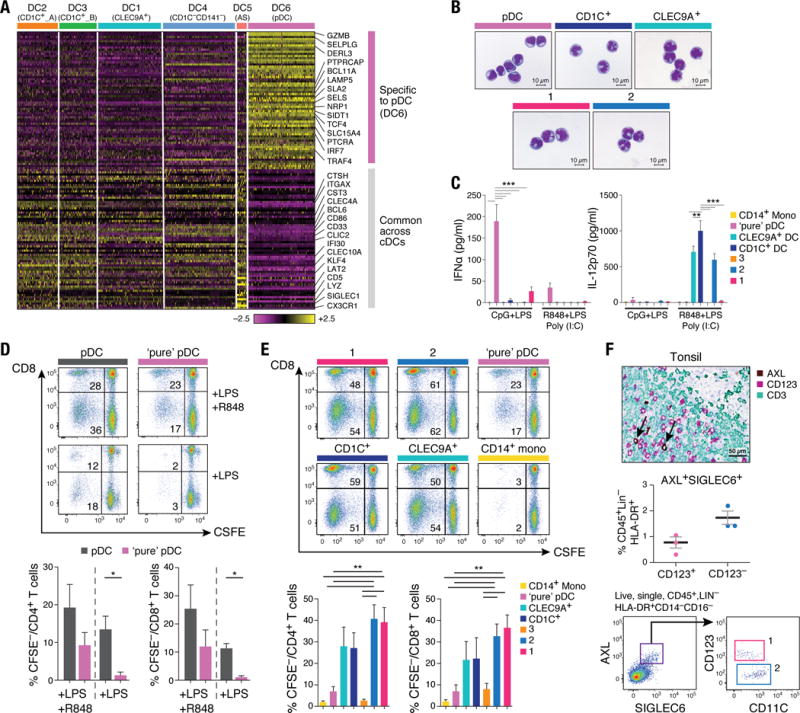
Figure 5. Phenotypic and functional characterization of AS DCs and “pure” pDCs.

(A) Heatmap reporting scaled expression (log TPM values) of gene sets common between AS DCs (DC5) and cDCs (clusters DC1 to DC4), and genes uniquely expressed in pDCs (DC6). Gene sets were generated through K-means clustering using the doKmeans function in the Seurat package. (B) Morphology of pDCs, CD1C+ DCs, CLEC9A+ DCs, AXL+SIGLEC6+CD123+CD11C−/lo and AXL+SIGLEC6+CD123loCD11C+ by Giemsa-Wright stain. Scale bar, 10μm. (C) IFNα (left panel) and IL-12p70 (right panel) concentration in culture supernatant 24 hours after CpG and LPS stimulation (n=8) or after LPS, R848 and poly(I:C) stimulation (n=4) of CD14++CD16− monocytes, pDCs, CLEC9A+ DCs, CD1C+ DCs, AXL+SIGLEC6+CD123+CD11C−/lo (1, pink), AXL+SIGLEC6+CD123loCD11C+ (2, blue), and CD100hiCD34int cells (3, beige). Composite data from four to eight donors is shown (mean ±SEM; **P<0.01, *** P<0.001, Mann-Whitney U test). (D) Proliferation of allogeneic CD4+ and CD8+ T cells 5 days after co-culture with pDCs contaminated with AXL+SIGLEC6+ cells compared with pDCs devoid of AXL+SIGLEC6+cells, in the context of LPS or LPS+R848 stimulation. Top: Representative pseudocolor dot plot. Bottom: Bar graphs of composite data (n=4, mean ± SEM, *P<0.05, paired t-test). (E) Proliferation of allogeneic CD4+ and CD8+ T cells 5 days after co-culture with CD14++CD16− monocytes, pDCs, CLEC9A+ DCs, CD1C+ DCs, AXL+SIGLEC6+CD123+CD11C−/lo (1, pink), AXL+SIGLEC6+CD123loCD11C+ (2, blue) cells, and CD100hiCD34int (3, beige) cells. Top: Representative pseudocolor dot plot. Bottom: Bar graphs of composite data (n=7, mean ±SEM, **P<0.01, paired t-test). (F) Top: Immunohistochemical staining of human tonsil with AXL (brown), CD123 (purple) and CD3 (green). Brown arrows depict AXL+CD123+ cells adjacent to CD3+ T cells. Data shown are representative of four donors. Scale bar, 50μm. Middle: Frequency of AXL+SIGLEC6+CD123+ and CD123lo/− cells in human tonsil determined by flow cytometry analysis, as a percentage of CD45+LIN(CD3,CD19,CD20,CD56,CD161)−HLA-DR+ cells (mean ± SEM of three donors shown; AXL+SIGLEC6+CD123+, 0.7 ± 0.2%; AXL+SIGLEC6+CD123lo/−, 1.7 ± 0.2%). Bottom: Representative pseudocolor dot plot of AXL+SIGLEC6+CD123+ (pop. 1, pink) and AXL+SIGLEC6+CD123lo/− (pop. 2, blue) cells in human tonsil by flow cytometry analysis (n=3).
