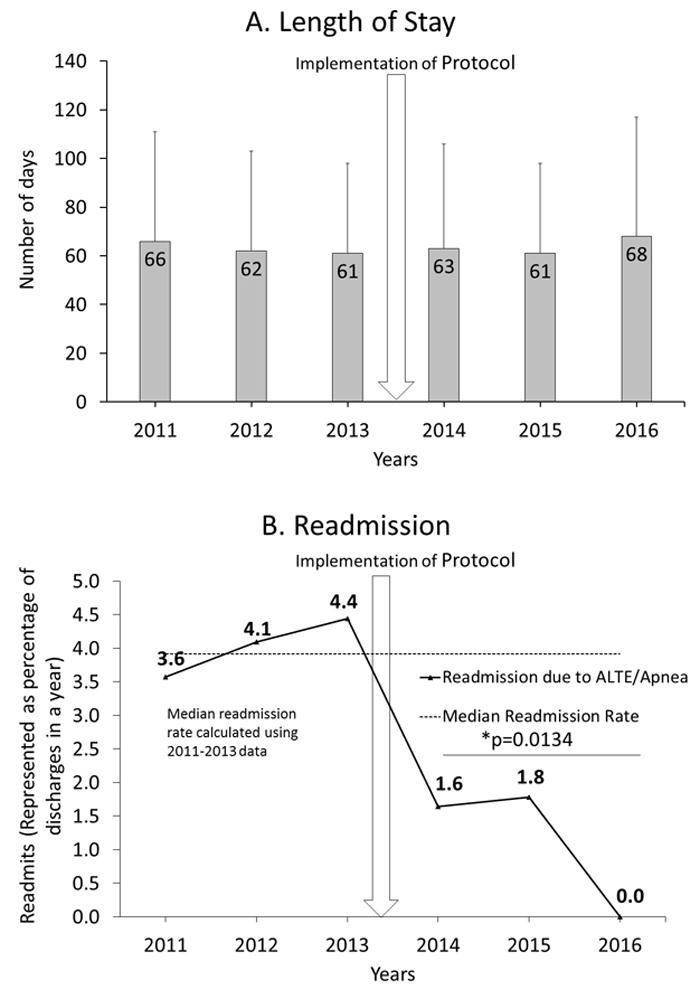
Figure 3.

a: Length of stay for all VLBW infants before and after implementation of the protocol (vertical arrow).
b: Readmission rates before and after implementation of the protocol. The median readmission rates were calculated between 2011-2013 (4.9%). The vertical arrow indicates the time of implementation of the protocol. The horizontal line with a *p-value (0.0134) shows the significance in readmission rate before (2011-2013) and after the protocol (2014-2016).
