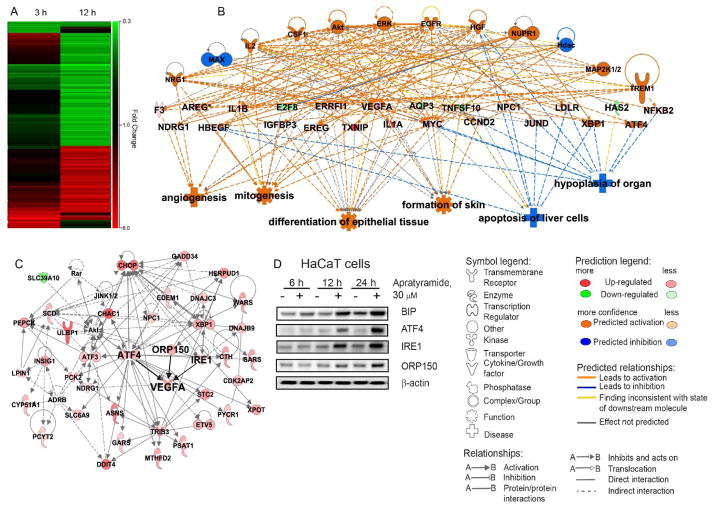
Figure 3.
Ingenuity Pathway Analysis (IPA) for transcriptome profiling of apratyramide (1). A) Heat map for transcript changes after 3 h and 12 h treatment with 30 μM 1. Red indicates up-regulation. Green indicates down-regulation. B) Top regulator effect network. C) Top related molecular network associated with the function of cellular compromise and cellular maintenance. D) Validation of selected hits from transcriptome profiling using immunoblot analysis.

