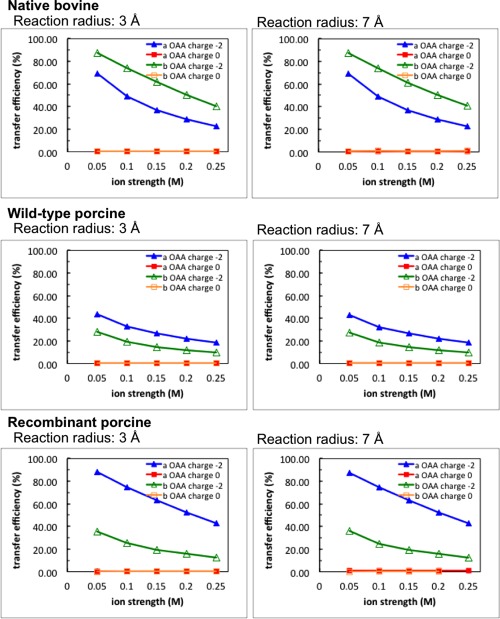
Figure 6.

The transfer efficiency of OAA molecules within three different metabolon models. OAA transfer efficiency from the MDH to CS active sites changes with ionic strengths. Blue and red lines indicate the transfer probability that the OAA molecules were diffused from MDH chain A with and without negative charges on the OAA, respectively. Green and orange lines indicate the charged and uncharged OAA molecules were diffused from MDH chain B, respectively. Left and right column show the simulations with reaction radius 3 and 7 Å, respectively.
