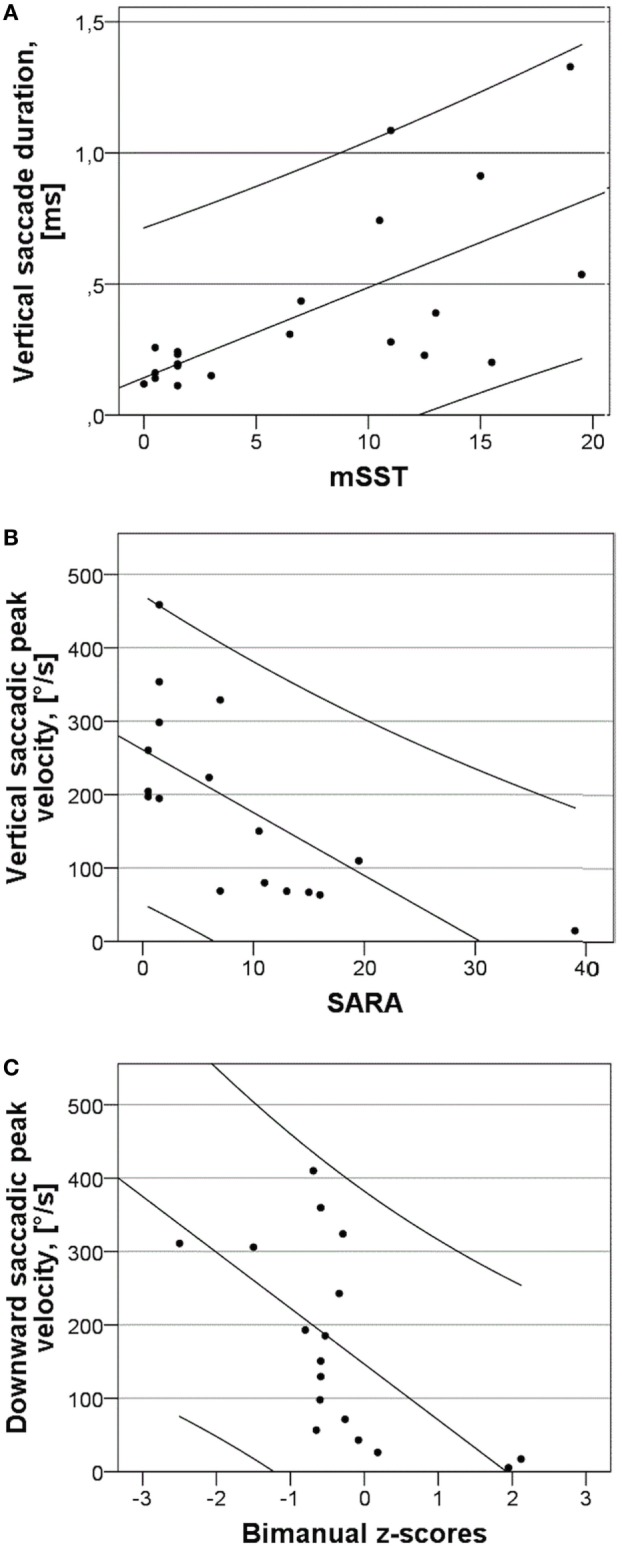
Figure 2.

Relationships between vertical and downward saccade characteristics and clinical rating scores and slopes of saccadic peak duration vs. amplitude of horizontal and vertical saccades. (A) Duration of vertical saccades in response to 20° stimulus and modified Severity Scoring Tool (mSST). The line has R2 of 0.836 and the variables are significantly associated with p < 0.0005. (B) Peak velocity (PV) of vertical saccades in response to 20° stimulus and Scale for the Assessment and Rating of Ataxia (SARA). The line has R2 of 0.468 and the variables are significantly associated with p = 0.001. (C) PV of downward saccades in response to 20° stimuli and bimanual z-scores of the grooved pegboard test. The line has R2 of 0.382 and the variables are significantly associated with p = 0.005.
