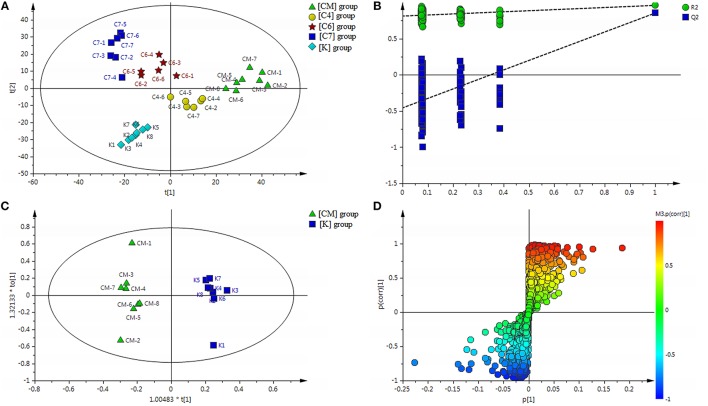
Figure 2.
(A) Results of multiple pattern recognition of serum metabolites in CUMS rats with or without exposure to PBR. PLS-DA score plot (n = 8, R2Y = 0.981, R2X = 0.531, Q2 = 0.811). (B) Results of permutation tests. R2 = 0.802, Q2 = −0.498. (C) OPLS score plot (n = 8, R2Y = 0.977, R2X = 0.391, Q2 = 0.873) of [K] group and [CM] group. (D) OPLS S-plot of [K] group and [CM] group. Each triangle in the S-plot represents an ion. Ions far away from the origin were potential biomarkers.

