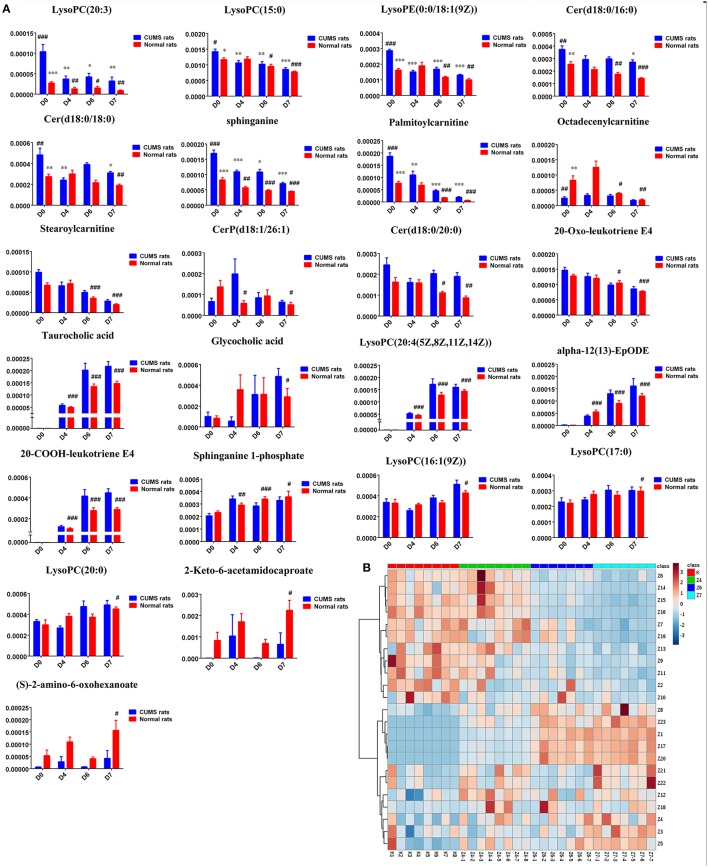
Figure 7.
(A) Normalized intensity levels of potential biomarkers in serum samples of normal rats (red), and the relative content of the corresponding metabolites in CUMS rats (blue). D0: administration of equal volumes of vehicle. D4: the concentration of PBR was 1.25 g/ml (expressed as the weight of raw materials). D6: the concentration of PBR was 5.0 g/ml. D7: the concentration of PBR was 10.0 g/ml. Data are presented as mean ± SEM. n = 8 each group. *P < 0.05, **P < 0.01, ***P < 0.001 vs. [CM] group; #P < 0.05, ##P < 0.01, ###P < 0.001 vs. [K] group. (B): the relative content of the heatmap of differential metabolites in serum samples of healthy rats with PBR administration. Class K: the [K] group. Class Z4: the [Z4] group. Class Z6: the [Z6] group. Class Z7: the [Z7] group. The ribbon −3~3: represents the relative content of the differential metabolites from low to high.

