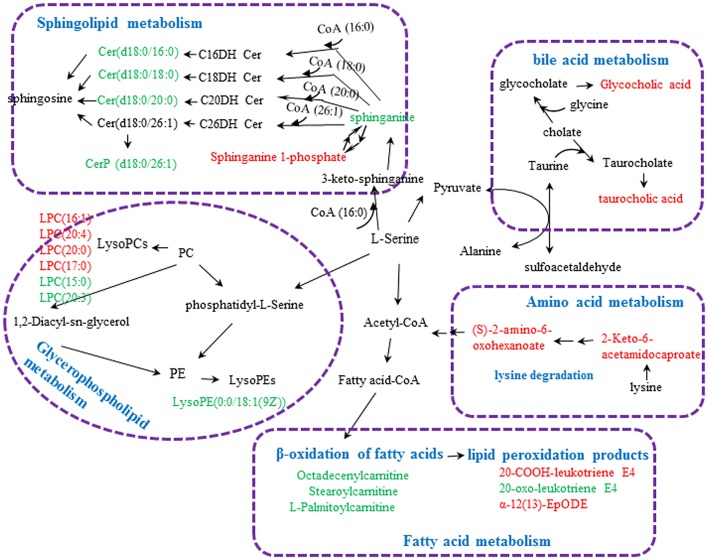
Figure 8.
Metabolic pathways involved in the [Z4], [Z6], or [Z7] group vs. the [K] group. Red fonts represent up-regulated metabolites in the [Z4], [Z6], or [Z7] group vs. the [K] group; Green fonts represent down-regulated metabolites in the [Z4], [Z6], or [Z7] group vs. the [K] group. Blue fonts represent the metabolic pathway.

