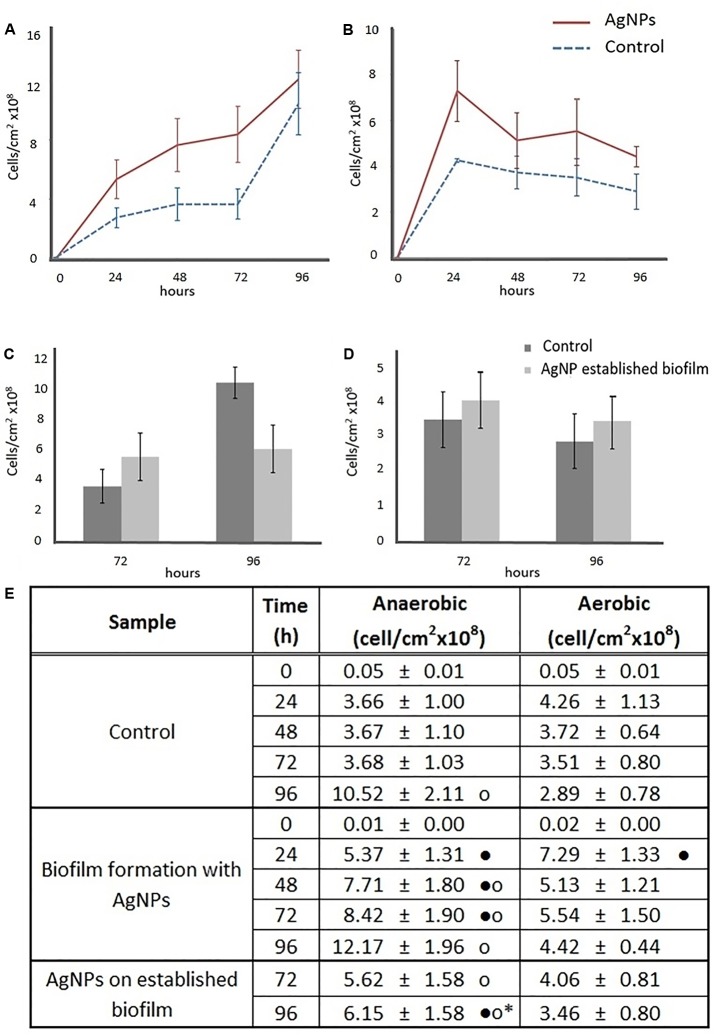
FIGURE 2.
Effects of AgNPs on Escherichia coli biofilm formation (A,B) and on a 72 h-old E. coli established biofilm (C,D). Growth curves were based on viable counts in presence of 0 (control) and 1 μg/mL AgNPs in anaerobic (A,C) and aerobic (B,D) conditions. Data in the table (E) represent the means ± standard deviation (SD) of three independent measurements. Dots provide the graphical representation for post hoc comparisons. According to post hoc analysis [Tukey’s honestly significant different test (HSD), p < 0.05], means sharing ∙ show statistical difference to the relative control, and anaerobic means sharing o show statistical difference to the aerobic counterparts. Means sharing • show statistical difference to the biofilm formation in presence of AgNPs counterparts.

