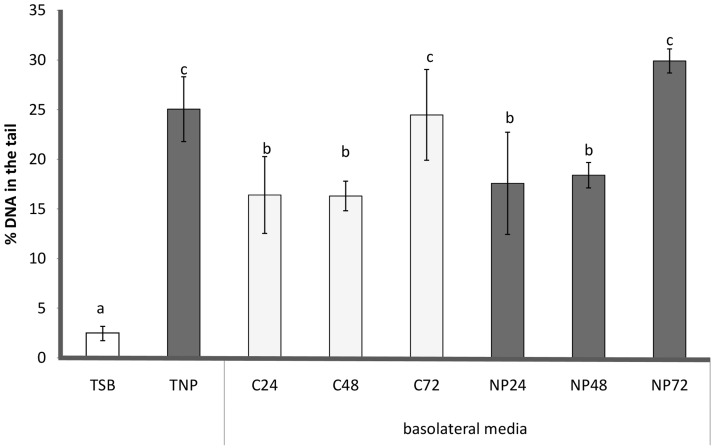
FIGURE 6.
Comet Assay: genotoxicity of different treatments, expressed as % of DNA in the tail (mean ± SD). Caco-2 cells were incubated with TSB (TSB), TSB with 1 μg/mL AgNPs (TNP), all the basolateral media from the anaerobic biofilm culture grown without (C24, C48, C72) and with AgNPs (NP24, NP48, NP72). Data not sharing common letter are significantly different, p < 0.05.

