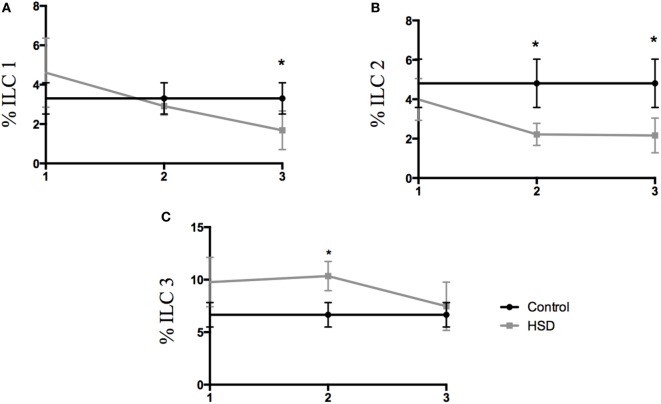
Figure 3.
Frequency of innate lymphoid cell populations changed during high-salt diet (HSD) consumption. Frequencies of ILCs were analyzed by flow cytometry in the colonic lamina propria of mice that received either control diet (n = 5–10) or HSD (n = 5–10) during 1, 2, and 3 weeks. (A) ILC1 (Lin-t-bet+); (B) ILC2 (Lin-GATA3+); (C) ILC3 (Lin- RORγt+). Graphs are representative of two independent experiments with five mice per group. Statistical analysis between groups was performed using Student’s t-test. *p < 0.05.

