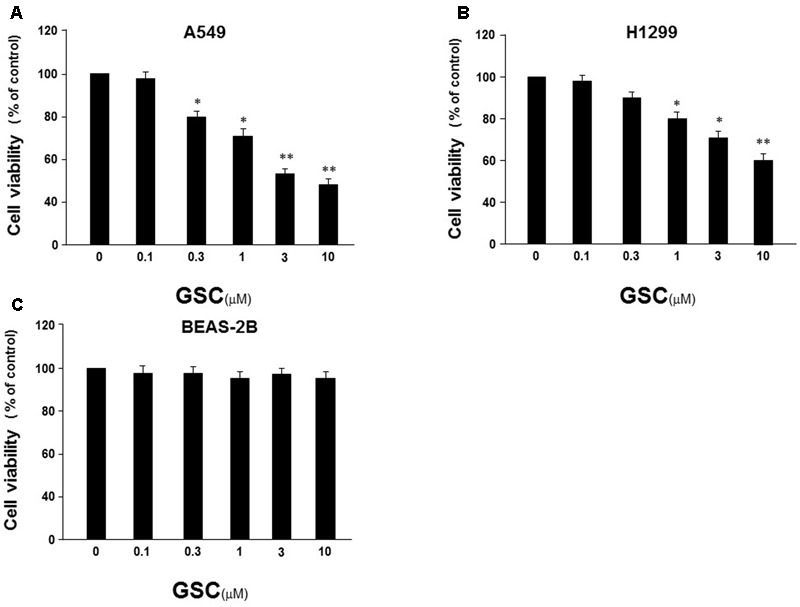
FIGURE 2.

Effect of GSC on the viability of NSCLC cells. (A) A549 cells were treated with GSC at different concentrations (0, 0.1, 0.3, 1, 3, 10 μM) for 24 h, and the cell viability was determined by MTT assay. (B) The treatment of H1299 cells was same to (A) and the cell viability was determined by MTT assay. (C) The treatment of BEAS-2B cells was same to (A) and the cell viability was determined by MTT assay. The results were expressed as the mean ± SD of three independent experiments and each was performed in triplicate. ∗p < 0.05, ∗∗p < 0.01 (compared with that of non-GSC treated group).
