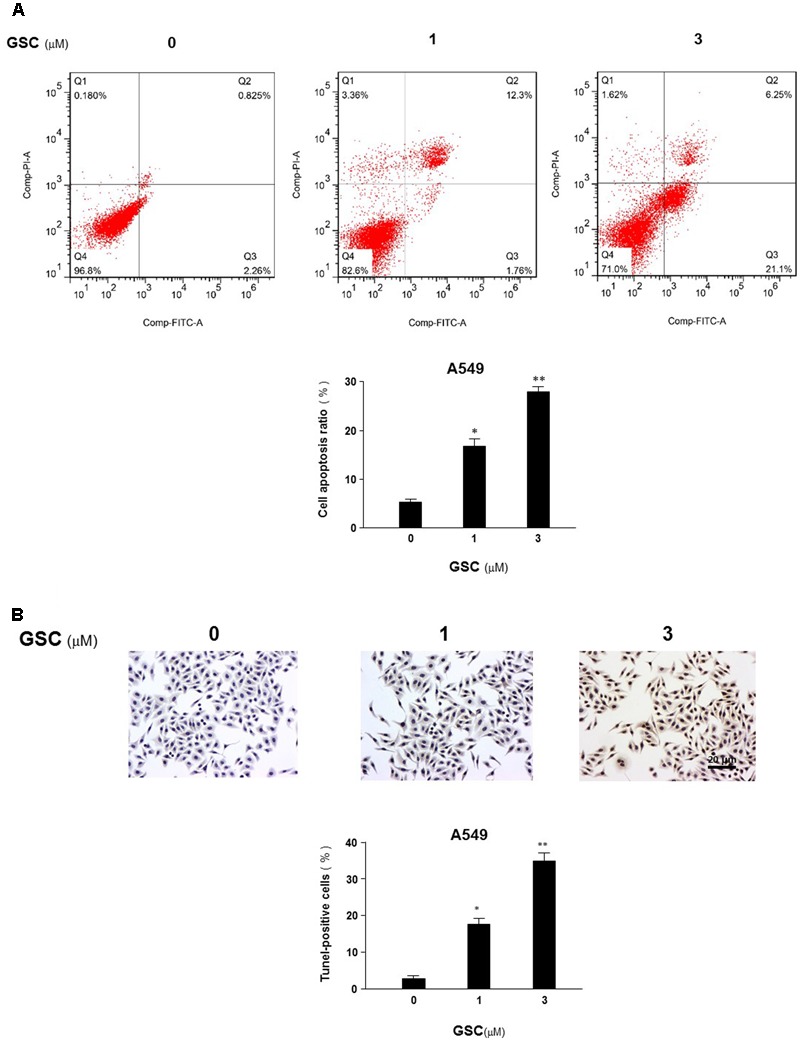
FIGURE 3.

Effects of GSC on apoptosis of A549 cells. (A) A549 cells were treated with GSC at different concentrations (0, 1, 3 μM). After 24 h later, all cells were harvested for flow cytometry analysis. Annexin V/PI-stained cells were analyzed with the percentages of apoptosis cells. Each experiments were carried out independently in triplicate. The percentage of annexin V positive cells is also included. (B) A549 cells were treated with GSC at different concentrations (0, 1, 3 μM) for 24 h and then TUNEL assays were performed. Apoptosis rate of A549 cells was expressed as the percentage of total cells counted. TUNEL staining profile of A549 cells was also shown. A dark brown DAB signal indicates positive staining while shades of blue–green to greenish tan signifies a non-reactive cell. The experiment results were shown as the mean ± SD of three independent experiments and each was performed in triplicate. ∗p < 0.05, ∗∗p < 0.01 (compared with that of non-GSC treated group).
