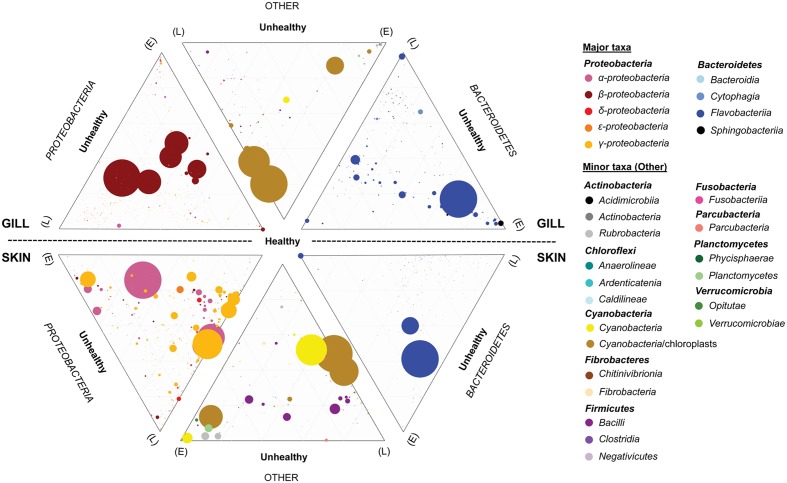
FIGURE 7.
Ternary plots depicting the global bacterial taxonomic landscape of OTUs between the gills and skin of farmed healthy YTK and unhealthy YTK exhibiting early (E) and late (L) stage enteritis. Each plot represents the contribution of each OTU as assigned to the different taxonomic classes for the predominant phyla Proteobacteria and Bacteroidetes, and the other phyla. The size of the circles represents the relative abundance of the OTUs between all other taxa within the same plot. Those taxa with a percentage abundance of <0.1% in any one individual were omitted from the plots. Grids represent divisions of 0.2.

