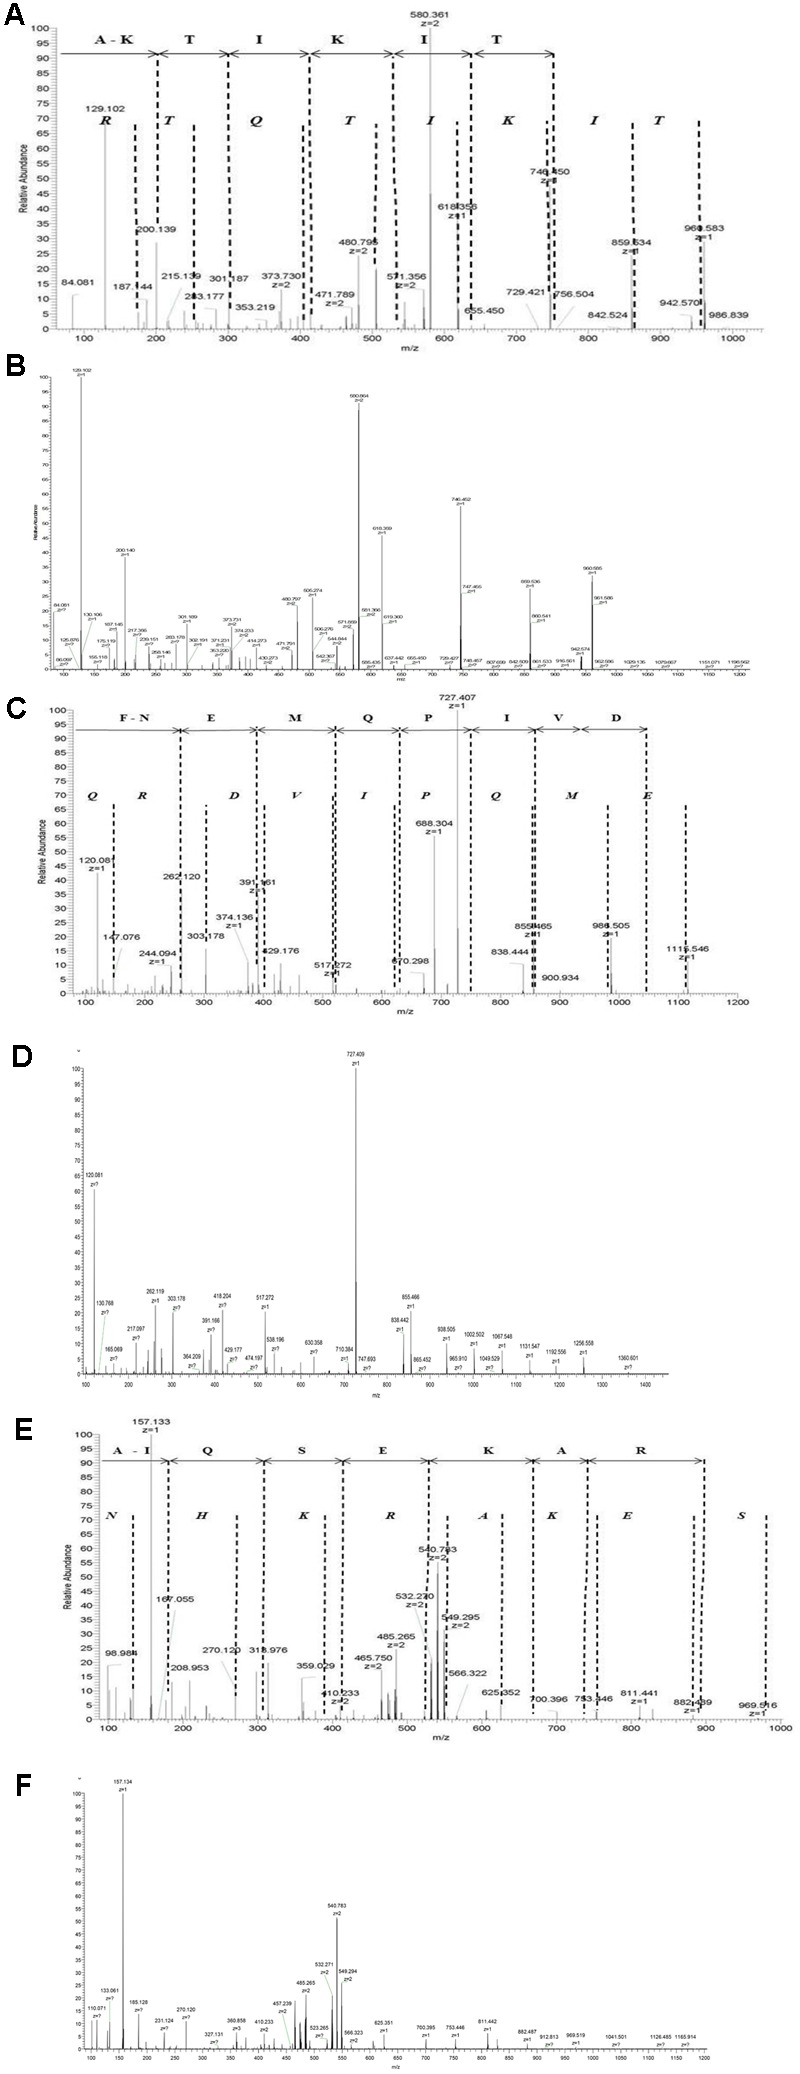
FIGURE 1.

Identification of AmiA peptide ligand AKTIKITQTR, AliA peptide ligand FNEMQPIVDRQ, and AliB peptide ligand AIQSEKARKHN. Manual interpretation of the fragment peaks is shown using non-italic letters for the b-ion (fragments appearing to extend from the N-terminal fragment) and italic letters for the y-ion. Representative fragment mass spectrum was confirmed for correct interpretation with fragment spectra of synthetic peptides (B, D, F). (A) AmiA peptide ligand: extracted ion chromatogram of the doubly charged peptide ion with mass-to-charge ratio (m/z) of 580.361 [retention time (RT) 15.98 min]. The b-ion series (fragments appearing to extend from the N-terminal) is annotated. Individual peaks for the last three amino acids Q, T, and R at the amino terminus are not visible in the b-ion series and are therefore not annotated, but Q–T–R is the mass difference between the last detectable b-ion at 756.504 and the molecular ion of 1141.70. (C) AliA peptide ligand: extracted ion chromatogram of the single charged peptide ions with mass-to-charge ratio (m/z) of 688. 83 (RT = 12.85 min, corresponding to sequence FNEMQPIVDRQ). Peaks corresponding to the two amino acids at the c-terminal, R and Q are not visible in the b-ion series and are therefore not annotated; R–Q is the mass difference between the last detectable b-ion at 1074.49 and the molecular ion of 1358.65. (E) AliB ligand: extracted ion chromatogram of the doubly charged peptide ions with mass-to-charge ratio (m/z) of 427.906 (RT = 12.85 min, corresponding to sequence AIQSEKARKHN). Individual peaks corresponding to the last three amino acids K, H, and N at the c-terminal are not visible in the b-ion series and are therefore not annotated, but K–H–N is the mass difference between the last detectable b-ion at 884.49 and the molecular ion of 1263.69. Manual interpretation of fragment peak for other peptides we identified can be found in Supplementary Figure S2.
