Figure 7.
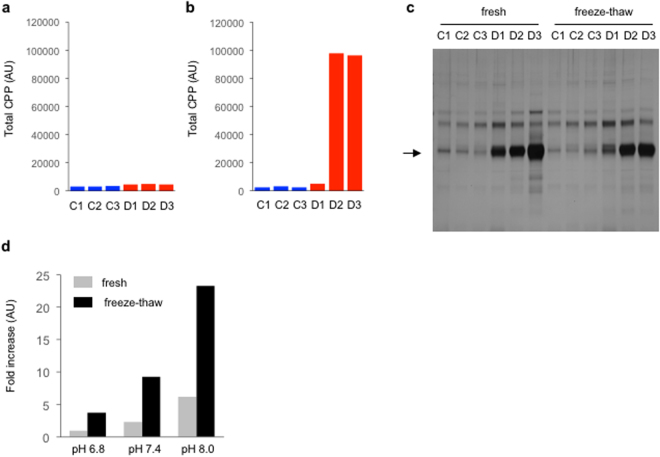
CPP in fresh plasma. Total CPP levels were measured in plasma samples from three control subjects (C1, C2, and C3, indicated as blue bars) and three dialysis patients (D1, D2, and D3, indicated as red bars). (a) Total CPP in fresh plasma. (b) Total CPP in the plasma samples frozen and thawed once. The aliquots of the fresh plasma samples used in (a) were snap-frozen in liquid nitrogen and stored at −80 °C until thawed for the CPP assay. (c) Pull-down of CPP from the fresh plasma and the freeze-thawed plasma samples using alendronate beads as in Fig. 1c. The arrow indicates fetuin-A. The full-length gel was shown in Supplementary information. (d) The transition of amorphous calcium-phosphate to crystalline calcium-phosphate induced by freeze-thaw. Nanoparticles of amorphous calcium-phosphate were suspended in DMEM with different pH (6.8, 7.4, and 8.0). The binding capacity of OsteoSense to the particles were quantified before and after one cycle of freeze-thaw.

