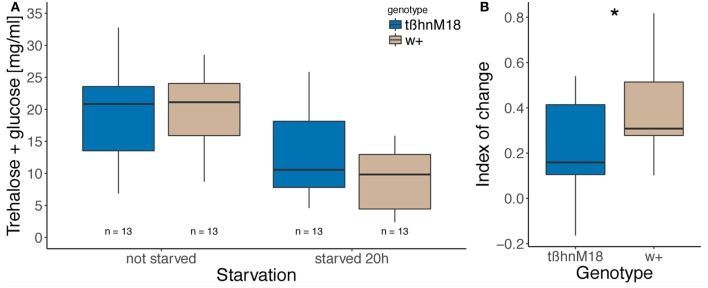
Figure 2.
Change in hemolymph glucose and trehalose after starvation is smaller in tßhnM18 mutants than in wild type. (A) Concentration of trehalose and glucose in the hemolymph of fed and 20 h starved flies, which was calculated from absorbance at 540 nm compared to calibration solutions, is shown in boxplots. Numbers indicate sample size. No statistical test was applied. (B) Index of the change (difference over the sum of the two numbers) in absorbance between the starved and the fed fly, paired per day. Numbers indicate sample size, asterisk denotes significant difference between genotypes (paired Wilcoxon rank sum test, p = 0.03223).

