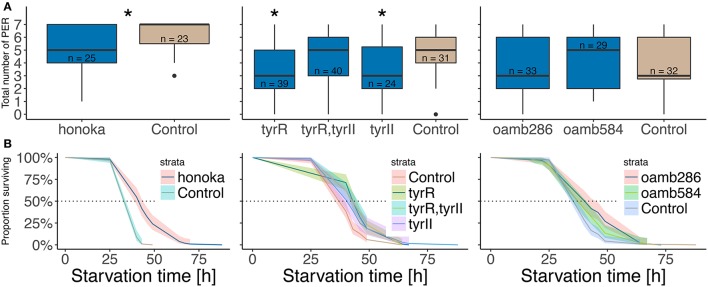
Figure 7.
Starvation resistance and sugar responsiveness in TA- and OA-receptor mutants. Total number of proboscis extensions (A) and Kaplan Meier survival curve (B, see Figure 3) in different female mutants and their respective control strains. See text for fly strain labels. The three different groups were tested independently and are therefore statistically treated as different experiments. (A) Numbers indicate sample sizes, asterisks denote significant difference between the mutant and its respective control group (Wilcoxon rank sum test, honoka p = 0.0117, Tyr p = 0.002911 and 0.007432). (B) 5 to 8 experiments were run per genotype, with about 35 flies per vial. Cox proportional hazards regression model was used to test statistical differences between mutants and their control, (different: honoka p = 1.4 × 10⁻¹⁴, TyrR,TyrII p = 10−5, TyrII p = 2.1 × 10⁻⁶, oamb286 p = 0.00029, not different: TyR p = 0.067, oamb584 p = 0.069, before bonferroni correction).

