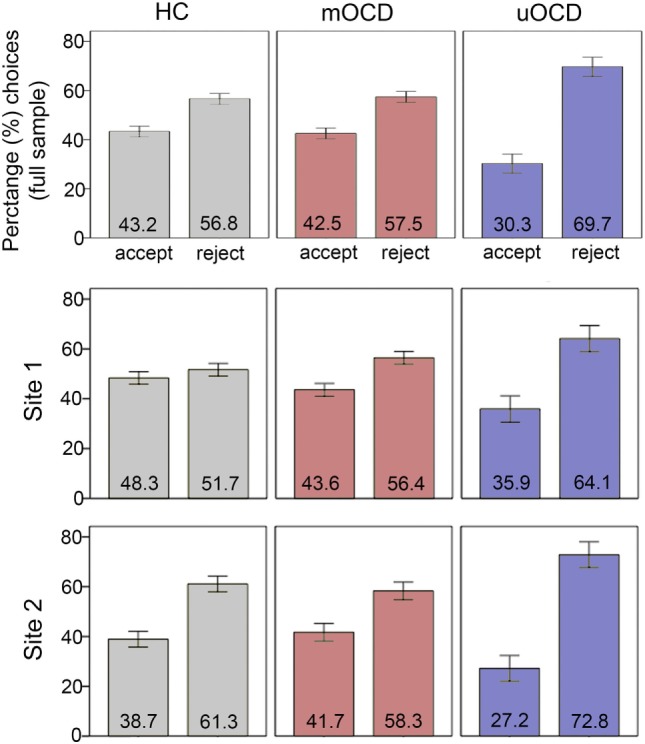
Figure 2.

Percentage of gambles that were accepted vs. rejected in HC, medicated OCD (mOCD) patients, and unmedicated OCD (uOCD) patients in the full sample (top panel) and in each site separately. Numbers overlaid on bars represent group means. Error bars represent ±1 SEM.
