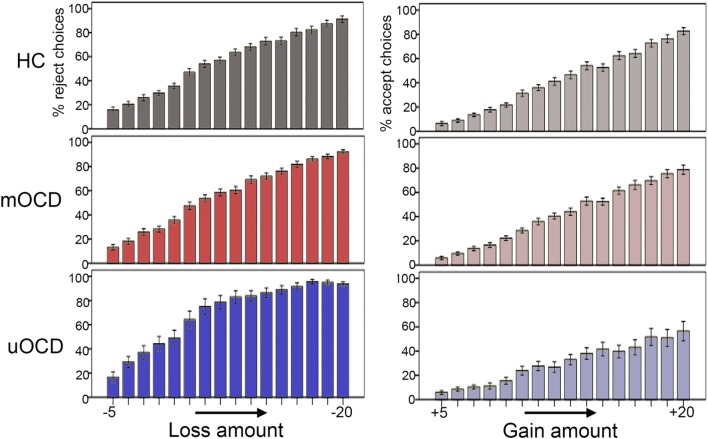
Figure 5.
Percentage of gambles that were rejected in relation to increasing losses (−5 to −20 in one-point increments) (left panel) and percentage of gambles that were accepted in relation to increasing gains (+5 to +20 in one-point increments) (right panel) in HC, medicated OCD (mOCD), and unmedicated OCD (uOCD) in the full sample. Error bars represent ±1 SEM.

