
FIGURE 5.
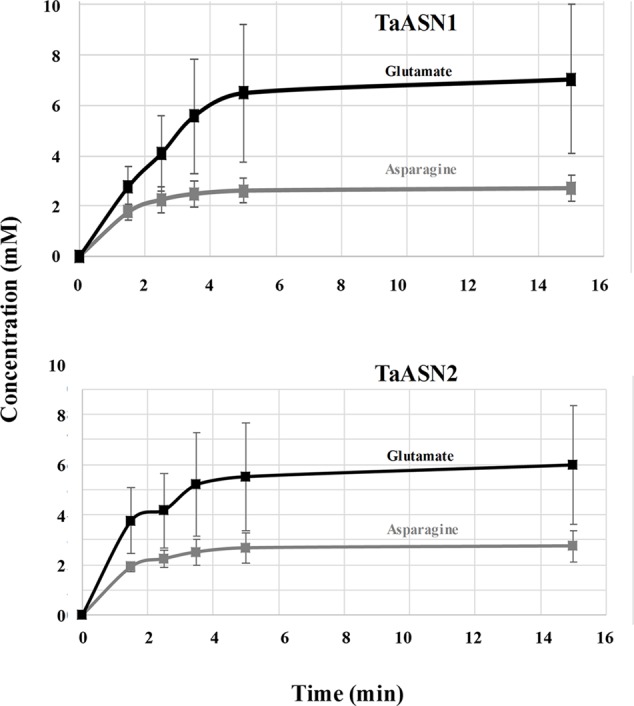
Plots (means with standard errors from two replicates) showing the synthesis of asparagine and glutamate, in reactions catalyzed by TaASN1 (top) and TaASN2 (bottom).
Official websites use .gov
A
.gov website belongs to an official
government organization in the United States.
Secure .gov websites use HTTPS
A lock (
) or https:// means you've safely
connected to the .gov website. Share sensitive
information only on official, secure websites.
Plots (means with standard errors from two replicates) showing the synthesis of asparagine and glutamate, in reactions catalyzed by TaASN1 (top) and TaASN2 (bottom).